2020 California Wildfires in 6 Audio-Visuals
by Ramesh Panuganty, Founder & CEO
2020 California Wildfires in 6 Audio-Visuals | MachEye
by Ramesh Panuganty, Founder & CEO
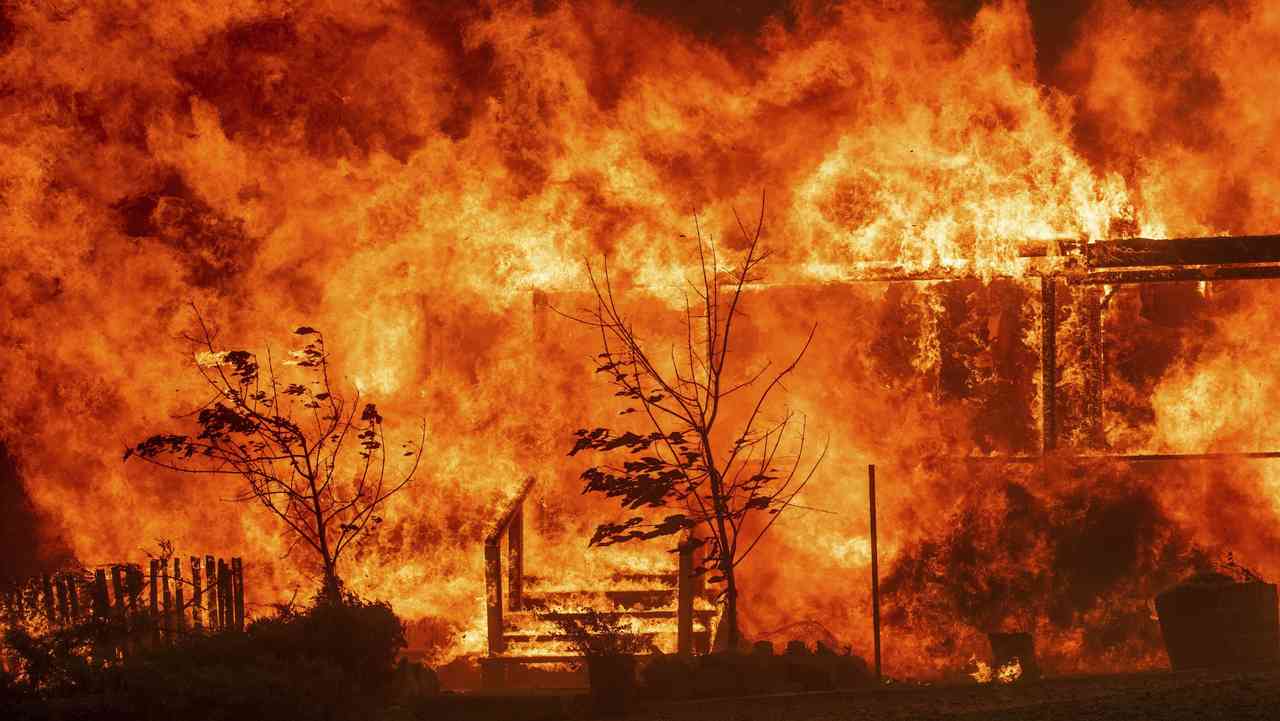
Did you know that the acreage burned by the 2020 California wildfires is shockingly 16 times larger compared to 2019, and is actually more than the combined total of the previous 4 years? The year 2020 was the largest wildfire season recorded in California's modern history. “16 times larger” is a significant impact that can no longer be ignored. Using data to analyze the bigger picture, instead of looking at isolated events, helps stakeholders and citizens understand the magnitude of these natural disasters.
To that end, the MachEye team used our AI-powered search analytics platform to analyze public data provided by the National Interagency Fire Center. We hope to increase awareness of wildfires with the aim to shape a better future. Analysis is the first part, but as always, communicating data insights is most of the challenge. When data is translated into easily consumable insights, its gravity and importance can be understood by a wider audience to stimulate faster action.
We urgently need better data experiences to help everyone understand data better and faster. Let’s see where California stands compared to the rest of the United States.
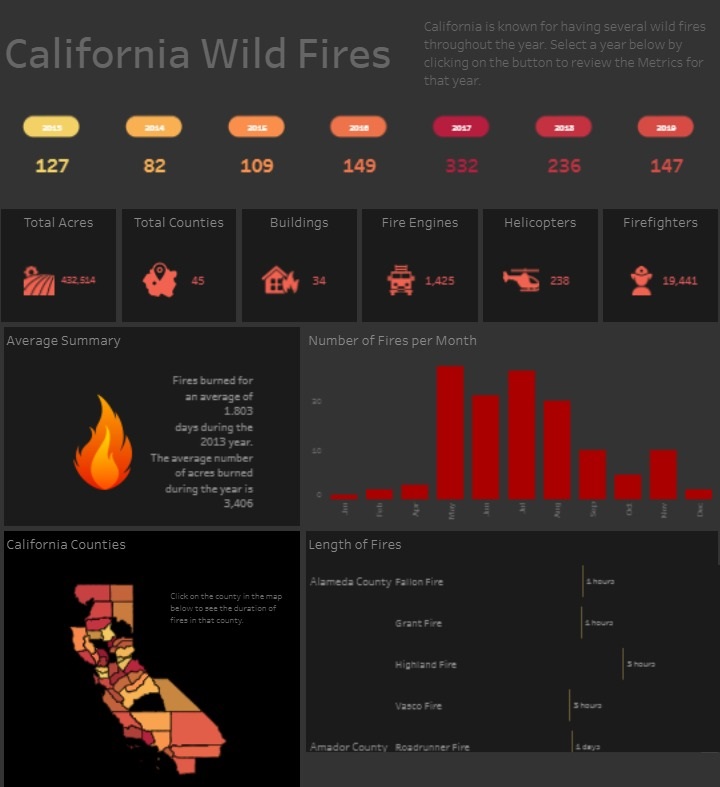
Analyzing with a Traditional Business Intelligence Solution
A static dashboard prepared by a traditional BI solution, as shown here, simply presents a subset of data without emphasis on which insights are important or actionable. It doesn’t discover new insights or contribute to increasing awareness of the problem. It lacks current data from 2020, uses vague terminology like length of fire, and does not present advanced insights like anomalies or trends for deeper understanding.
The Modern Generation of BI
This is where advanced BI solutions improve the data experience. In addition to extracting deep insights, modern BI tools enable everyone to easily converse with data and discover actionable insights in an engaging way.
Using MachEye, we asked the following simple query "wildfires" to the NIFC data:

In its response, MachEye not only analyzed the historic information of the past 10 years, but also included the latest available information for the current year. Across the entire United States over the past 10 years, there were an average of 62,000 wildfires annually and an average of 7.5 million acres burned annually. As of November 2020, over 52,000 wildfires have burned nearly 10.8 million acres this year.
To present insights, MachEye automatically generates an interactive audio-visual that can be played and paused.
Here are 6 insights accompanied by excerpts from the audio-visual
1. 2020 wildfires are the largest in the past ten years
Across the US, wildfires burned a total of 75.89 million acres from 2011 to 2020. The 2020 wildfires are the largest in terms of yearly acreage burned.
2. Acreage burned doubled in 2020 as compared to a year ago
MachEye automatically discovers click-less intelligence based on context, available data, user interest, and behavior. The audio-visual answers the asked query and then continues with AI recommended insights to help the user answer "why" this is happening.
As compared to 2019, there is a sharp increase in the acreage burned in 2020 in the US.
3. California accounts for higher than 46 states acreage burned in 2020
The state of California stands out as an anomaly in the 2020 wildfires when compared to other states and the overall average. The acreage burned in California is 4.36 million, which is 40% of the total US acreage burned in 2020. When compared across 50 states, it is 19 times above the overall average.
4. California wildfires burned 11.29 million acres over the past decade
From 2011 to 2020, wildfires in California burned a total of 11.29 million acres over the past decade and 4.36 million acres in 2020.
5. 2020 Acreage burned in California is higher than the past 4 years combined
The 2020 California wildfires are 2.86 times above the average in terms of acreage burned. They even exceeded the combined acreage burned in the last 4 years and represent 38.6% of the total in the past decade.
6. 2020 acreage burned by California wildfires is 16 times larger than in 2019
The magnitude of the wildfires is significant when an analogy is drawn between 2019 and 2020 data. At 4.36 million, the acreage burned in California grew sharply by 16 times as compared to the acreage burned in 2019.
With a simple query like “wildfires”, MachEye explores data across different dimensions and uncovers advanced insights like anomalies and analogies. MachEye presents these insights as crisp interactive audio-visuals ready to be consumed at the click of a “play” button. With its click-less intelligence, everyone can easily access engaging and insightful data experiences to help with wildfire impact analysis and risk assessment.
When people are empowered with the best data experience, they can manage difficult situations and find the best path forward – all with the power of data.
We hope we’ve raised some awareness around the magnitude of California wildfires and showed how data can help us focus on protecting people, the environment, and the economy.
If there’s another dataset you’d like to see analyzed in MachEye, please reach out to us at hello@macheye.com.