
Demystifying mortality rates in the USA between 2019 and 2020
by Gopinath Vasanthakumar, Product Manager
Demystifying mortality rates in the USA between 2019 and 2020
by Gopinath Vasanthakumar, Product Manager
Mortality rate is an important metric and tracking it becomes essential, especially in the midst of a pandemic. Numbers can be tricky. On one hand, they help us understand situations and make data-driven decisions. But on the other hand, they can also be confusing and conflicting. Throughout 2020, there was one set of numbers that overwhelmed us through every medium – the daily mortality rate. Multiple agencies, both government and private, tracked and reported these numbers. Many a time there were conflicting reports with missing data. Though COVID-19 may have been the biggest contributor, in many cases it was difficult to pin down the exact cause.
We at MachEye wanted to put into perspective the differences in 2020 mortality rates compared to 2019. The aim was to demystify the numbers, irrespective of the causes of death. To achieve this, we focused on what researchers call “excess death”. Excess deaths are the difference between the number of deaths that were expected to occur during a given time period and the number of deaths that actually occurred.
For this analysis, we used the data set made available by National Center for Health Statistics, CDC. CDC reports mortality data as quarterly rates and 12 month-ending rates. We compared the available mortality data across 2019 and 2020 for 21 months, from January 2019 to September 2020.
Understanding the deaths across US states
We asked the following simple query to the data in MachEye:
“compare monthly deaths in 2019 vs 2020”
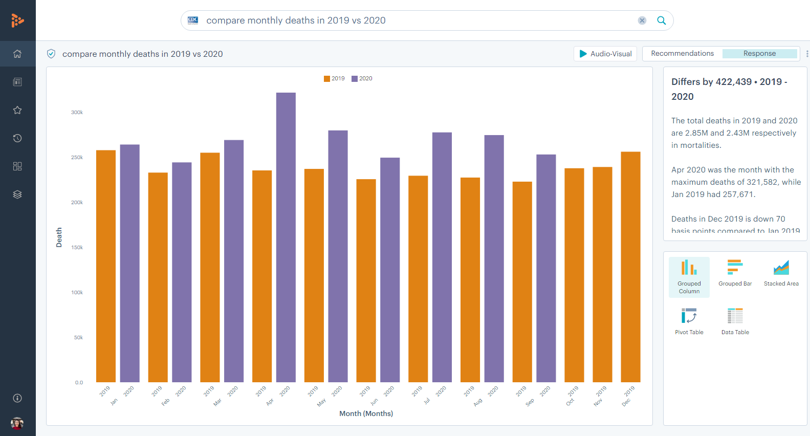
In its response, MachEye found that there were 2.43 million deaths from January to September 2020. The mortality rate grew by 14.6% as compared to the 2.12 million deaths during the same period in 2019. New York’s deaths in 2019 were a little over 50% of California's. But in 2020, New York still peaked the most and saw a surge in deaths, despite being only the fourth most populous state in the USA.
Going beyond this comparison, MachEye also discovered advanced insights on analogies, growth rate, clusters, and anomalies that a traditional BI solution would have missed. These insights were explained across different dimensions like months, years, and states.
To present these insights, MachEye automatically generated the following interactive audio-visual that can be paused and drilled down to view detailed figures.
Here are some observations MachEye discovered in the NCHS mortality data
Average monthly deaths increased by 13.6% in 2020
In 2020, the average monthly deaths were 270,272. This number was 13.6% higher than the monthly average of 237,907 in 2019.
April 2020 was the highest mortality month
321,582 fatalities occurred in the month of April. This was 19% above the overall average across 9 months. The death toll in April 2020 was 36.72% higher than the previous year, while January 2020 deaths had the lowest increase of 2.43% compared to a year ago.
New York saw the highest increase in fatalities at 35.3%
Monthly trend analysis shows a surge in average deaths per state of 12% in 2020 compared to the same period in 2019 (January 2019 – September 2019). Among all states, New York had the highest growth of 35.3%.
New York’s mortality rate spiked 50% above its monthly average between March and May 2020
MachEye’s Click-less Intelligence analyzed New York numbers further to find that the spike in mortality rates for New York was primarily due to the 3 months of March, April and May 2020 – 50% above the monthly average of deaths in New York. Further analysis on the monthly trend suggested that the April 2020 spike in New York is 3.27x higher compared to 2019.
No changes observed for Hawaii
While New York was the hardest hit, Hawaii showed the least growth of 1.50% between January and September 2020 as compared to a year ago. The estimated death trend for Hawaii also remained flat with no changes during this period.
2020 was a shocking and traumatic year for the entire world, and we send our gratitude to the thousands of healthcare professionals and essential workers for their tireless efforts in overcoming the pandemic. We hope normal life will return sooner rather than later, and hope everyone remains safe and healthy in 2021.
* Note: At the time of our analysis, the deaths data from NCHS was available only till September 2020. Once NCHS releases the data for the remaining months of 2020, we will publish our updated analysis.