About the Dataset
This analysis showcases the trends in individuals encountered and reported by the US Customs & Border Protection in their Nationwide Encounters report, and juxtaposes this data with American Births sourced from CDC Natality Information.
Please note that the terms "undocumented migrants", "illegal immigrants", or "aliens" refers to the officially recorded encounters. The actual number may be higher due to undetected cases.
This dataset is obtained from www.cbp.gov, and this article is published on 29 DEC 2023. Note that the available dataset may only be a small portion of complete set at any given point.
Automated Data Catalog with MachEye
With its low-prep/no-prep data catalog process, MachEye categorizes data into entities and attributes, identifies entity relationships, and enriches the metadata by assigning friendly names. MachEye also measures the quality of data across multiple parameters such as clarity, completeness, consistency, integrity, interpretability, timeliness and uniqueness and scores it on a data quality index. The lower the score, the higher the data quality.

Data Quality Index
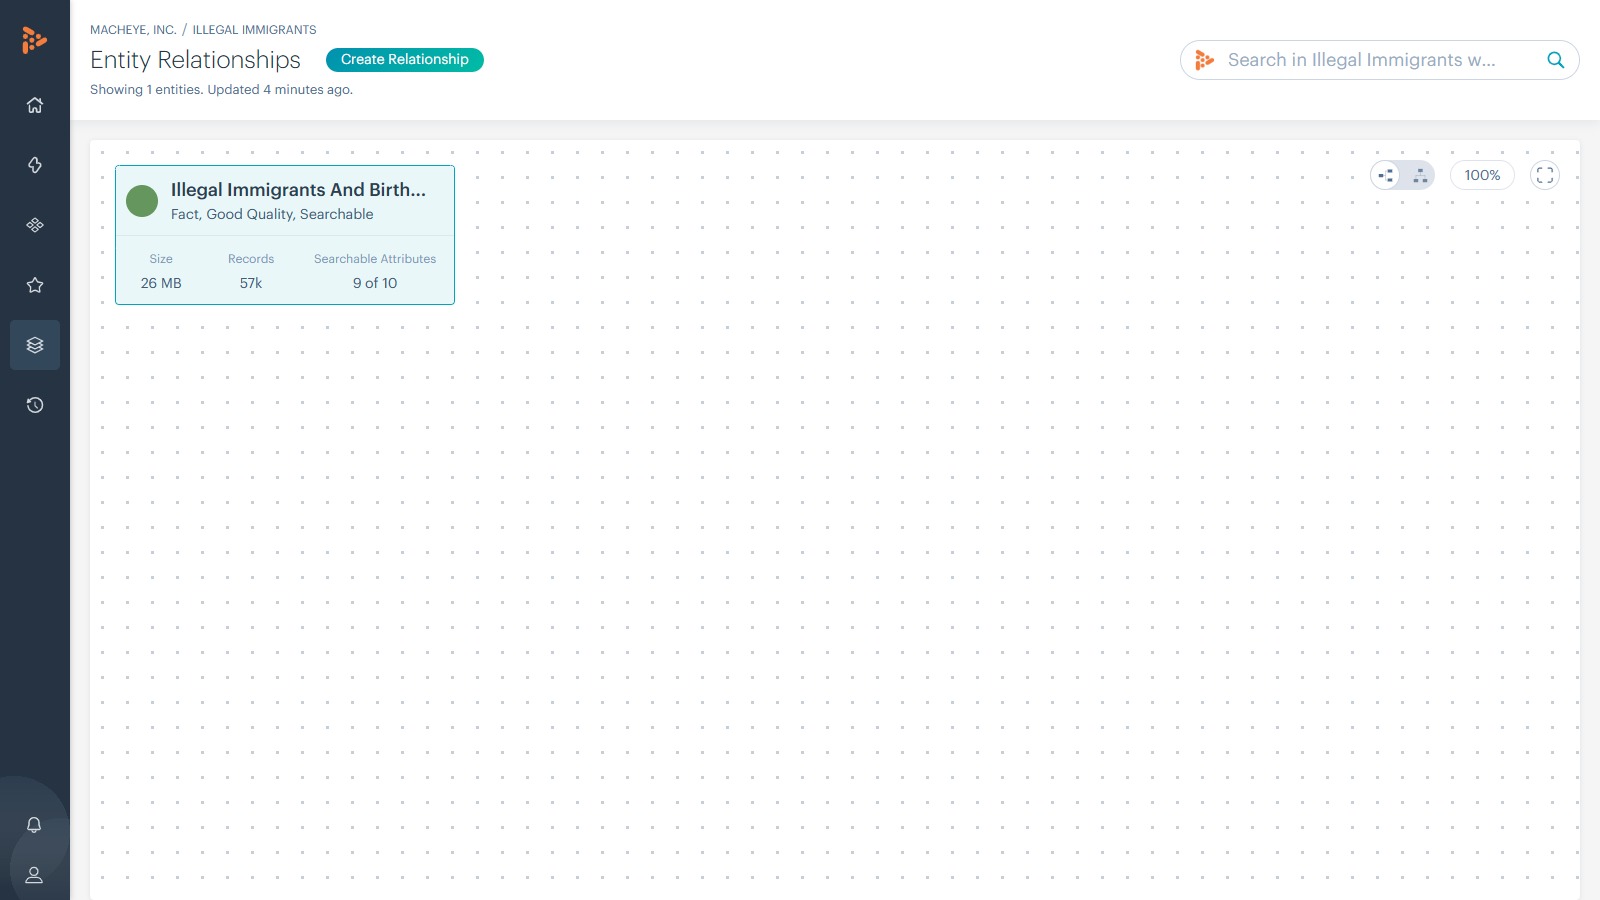
Entity Relationships
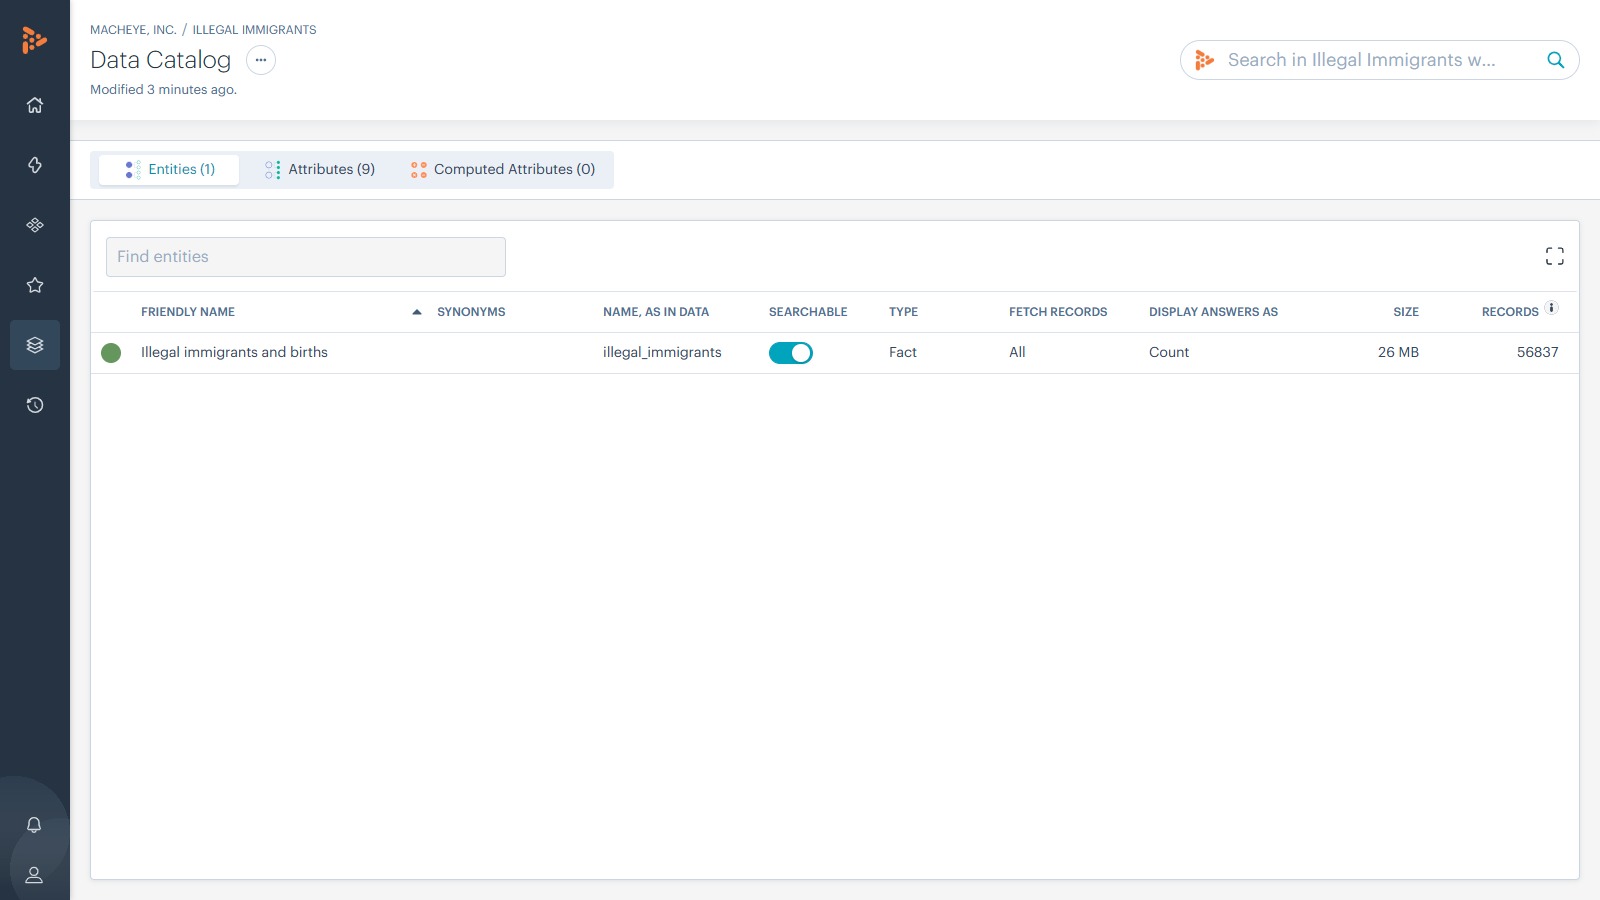
Data Catalog
Dataset Insights from MachEye
Here are some interesting answers to questions and insights presented by MachEye on this dataset. These answers and insights are presented in the form of interactive charts, pivot tables, text narratives, and audio-visual data stories.
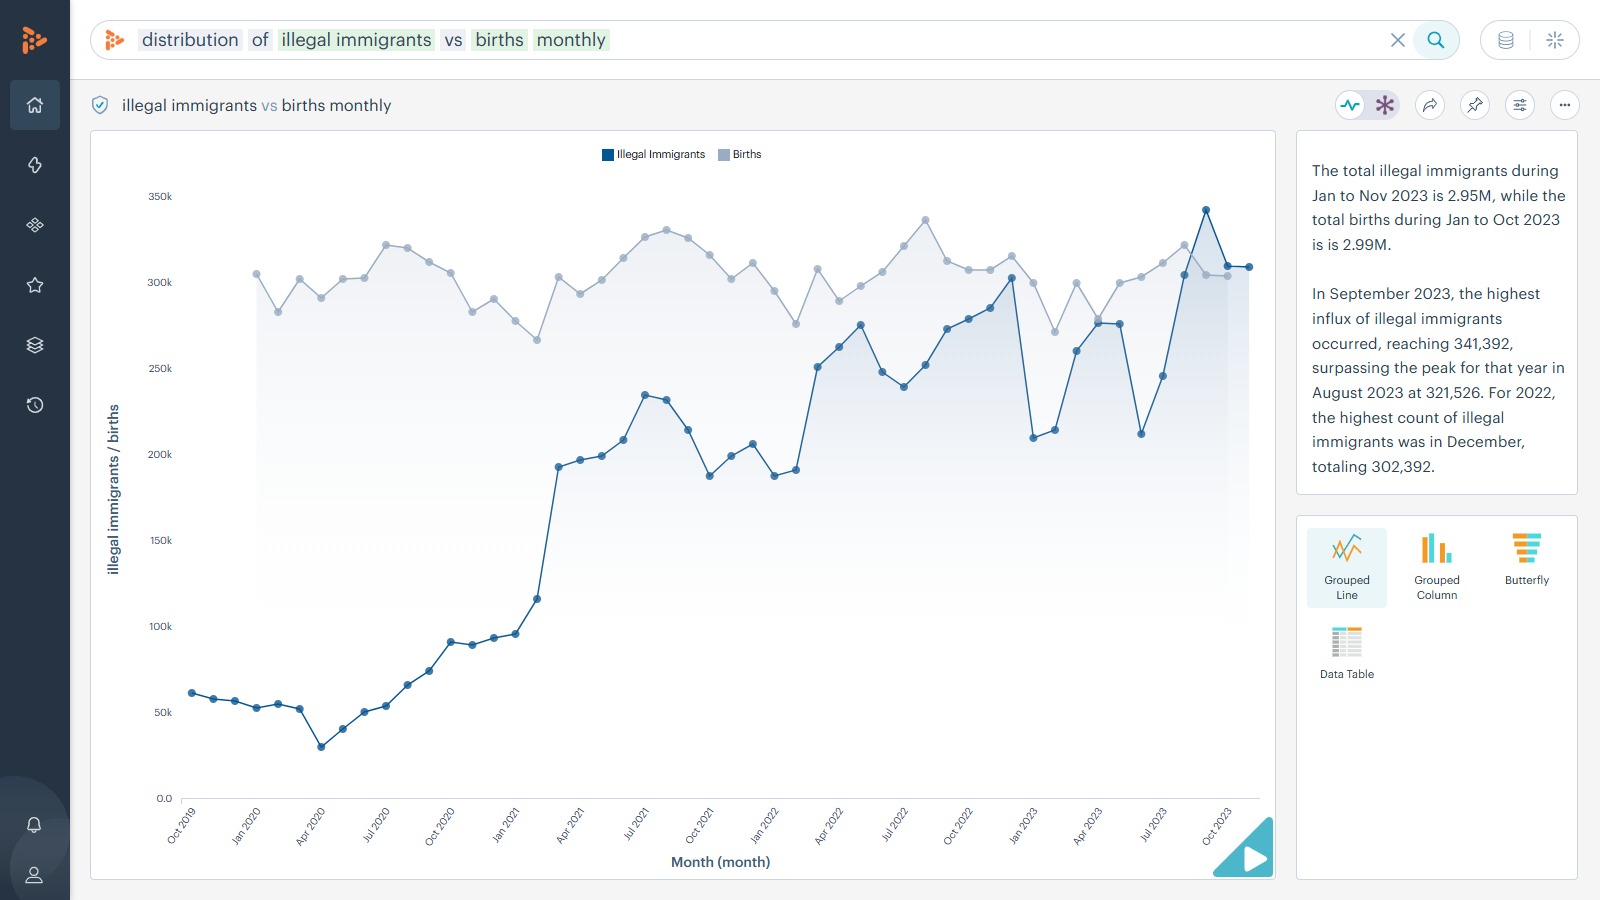
Distribution of illegal immigrants vs births monthly
The total illegal immigrants during Jan to Nov 2023 is 2.95M, while the total births during Jan to Oct 2023 is is 2.99M. In September 2023, the highest influx of illegal immigrants occurred, reaching 341,392, surpassing the peak for that year in August 2023 at 321,526. For 2022, the highest count of illegal immigrants was in December, totaling 302,392.
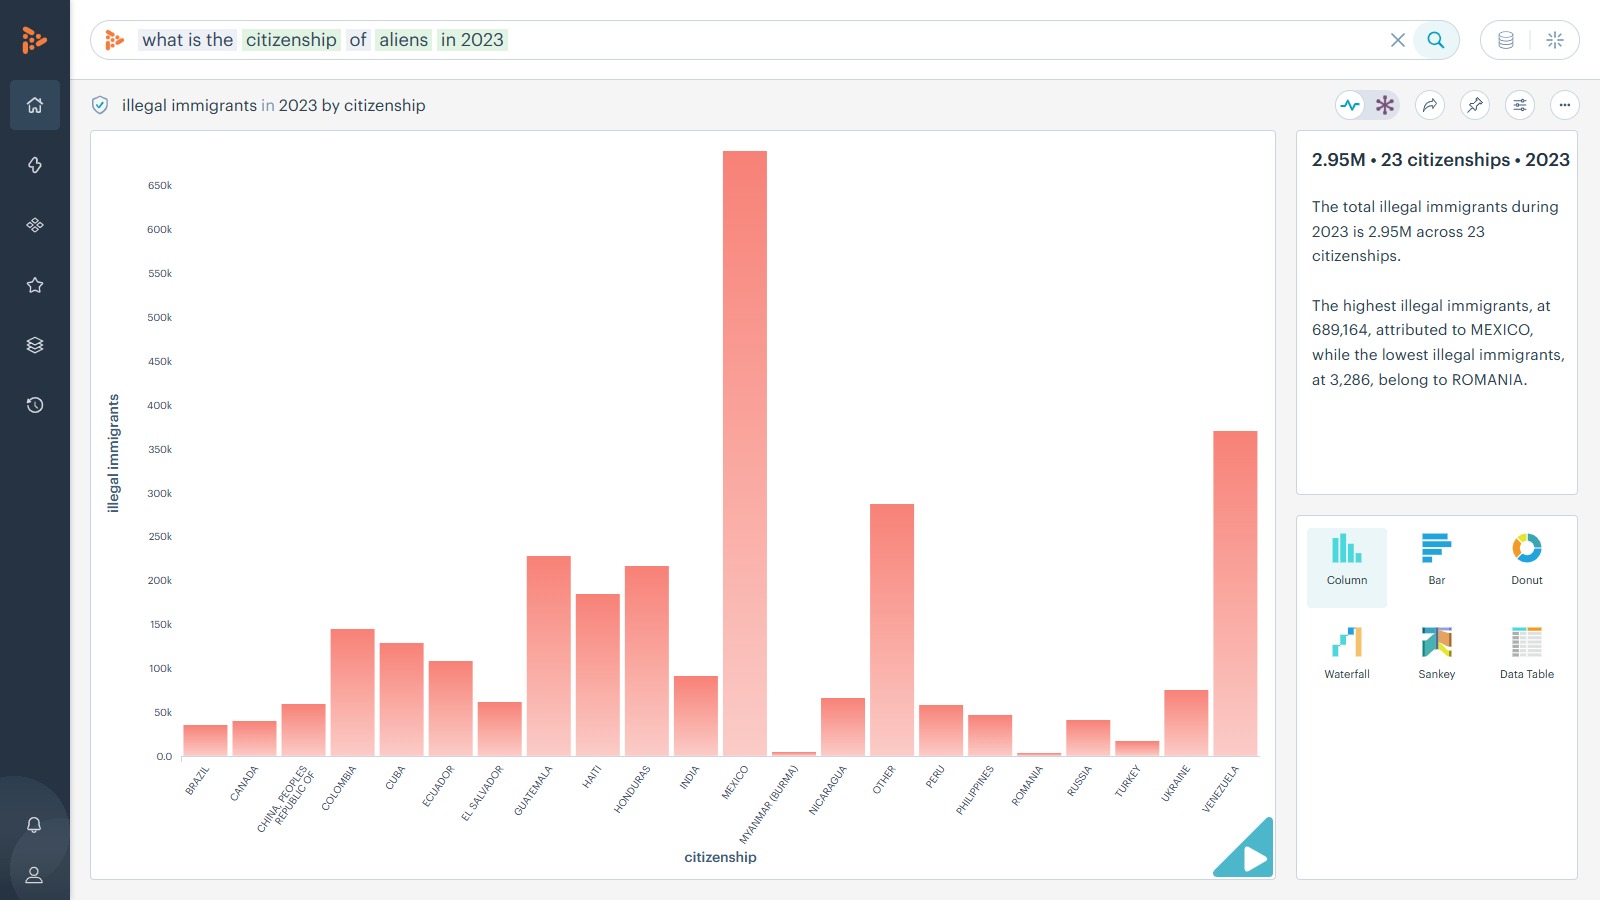
What is the citizenship of aliens in 2023?
The total illegal immigrants during 2023 is 2.95M across 23 citizenships. The highest illegal immigrants, at 689,164, attributed to MEXICO, while the lowest illegal immigrants, at 3,286, belong to ROMANIA.
Growth Rates
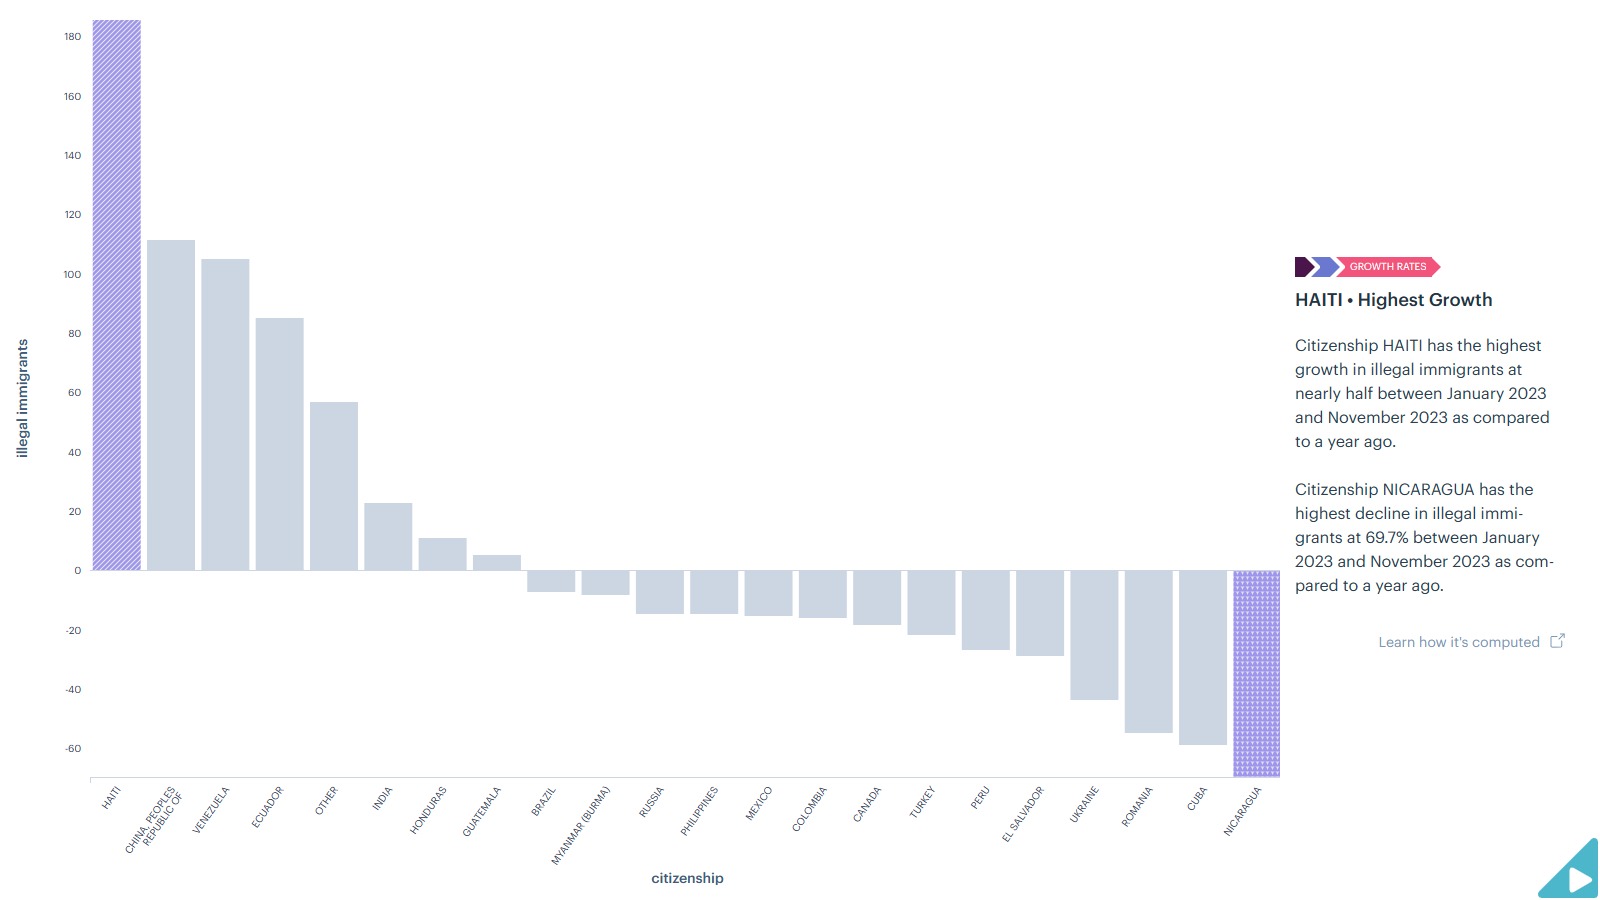
Insights in the citizenship of aliens in 2023?
Citizenship HAITI has the highest growth in illegal immigrants at nearly half between January 2023 and November 2023 as compared to a year ago. Citizenship NICARAGUA has the highest decline in illegal immigrants at 69.7% between January 2023 and November 2023 as compared to a year ago.
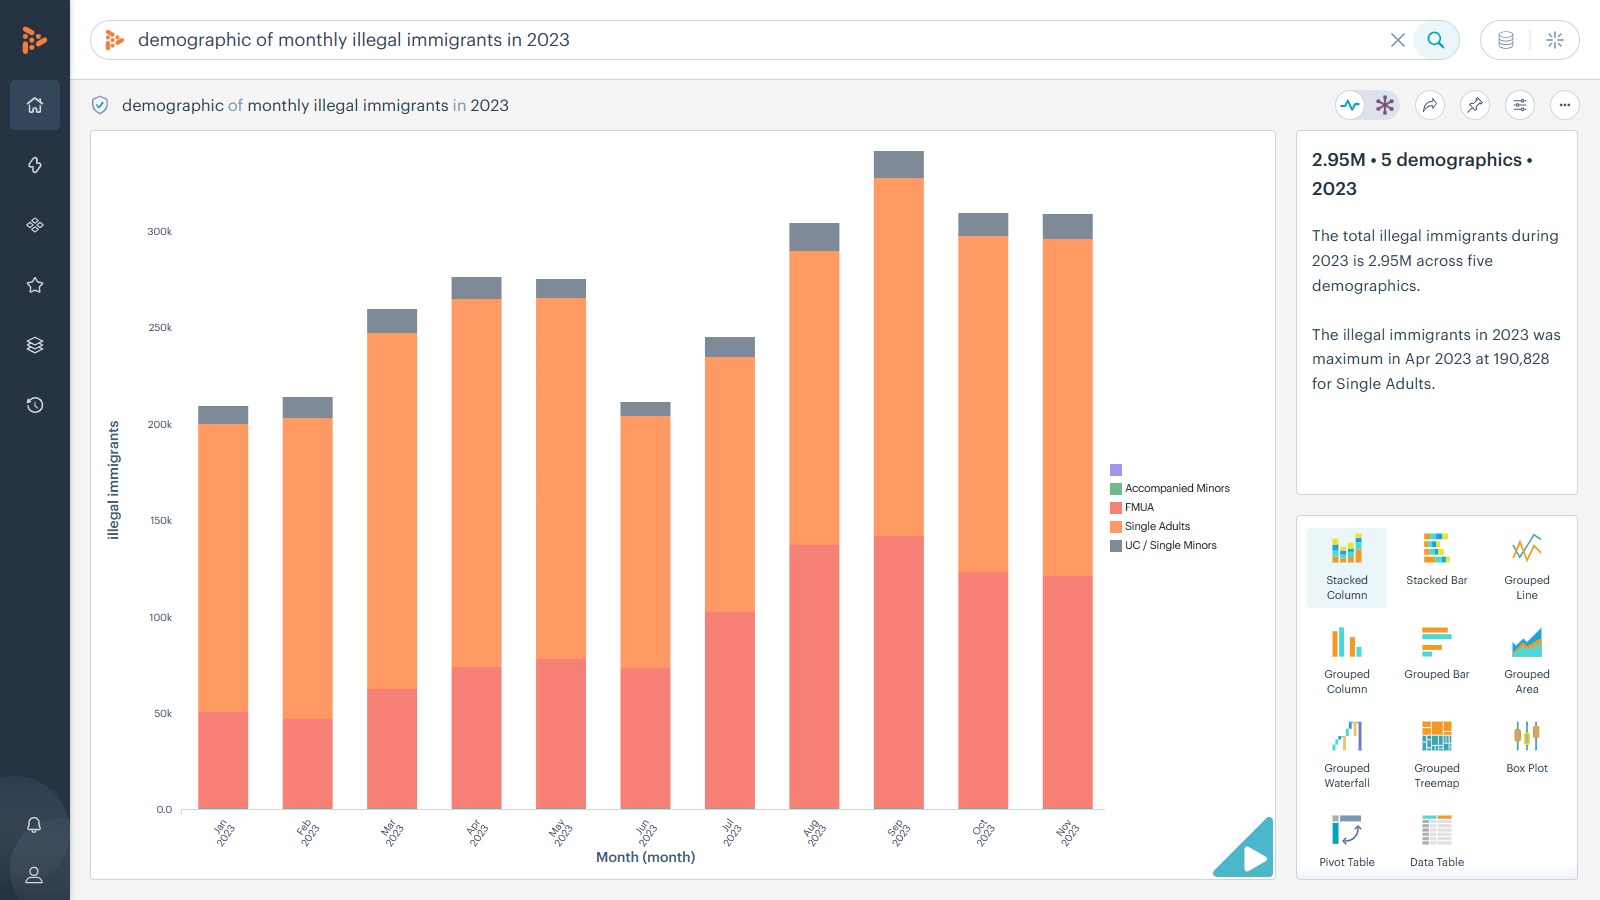
Demographic of monthly aliens in 2023
The total illegal immigrants during 2023 is 2.95M across five demographics. The illegal immigrants in 2023 was maximum in Apr 2023 at 190,828 for Single Adults.
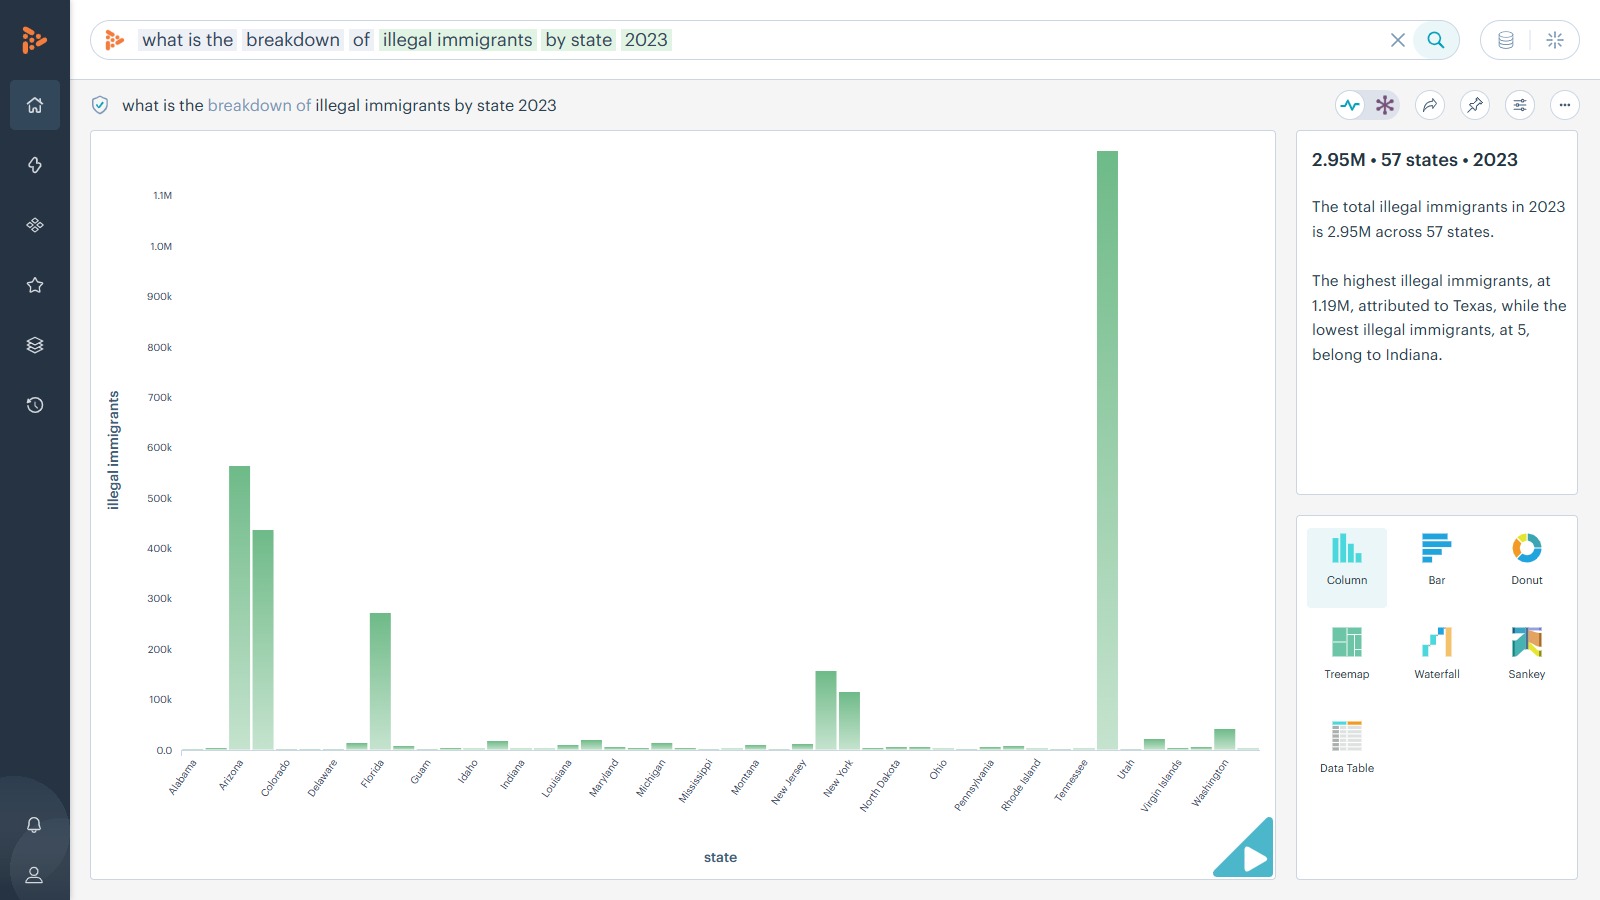
What is the breakdown of illegal immigrants by state 2023
The total illegal immigrants in 2023 is 2.95M across 57 states. The highest illegal immigrants, at 1.19M, attributed to Texas, while the lowest illegal immigrants, at 5, belong to Indiana.
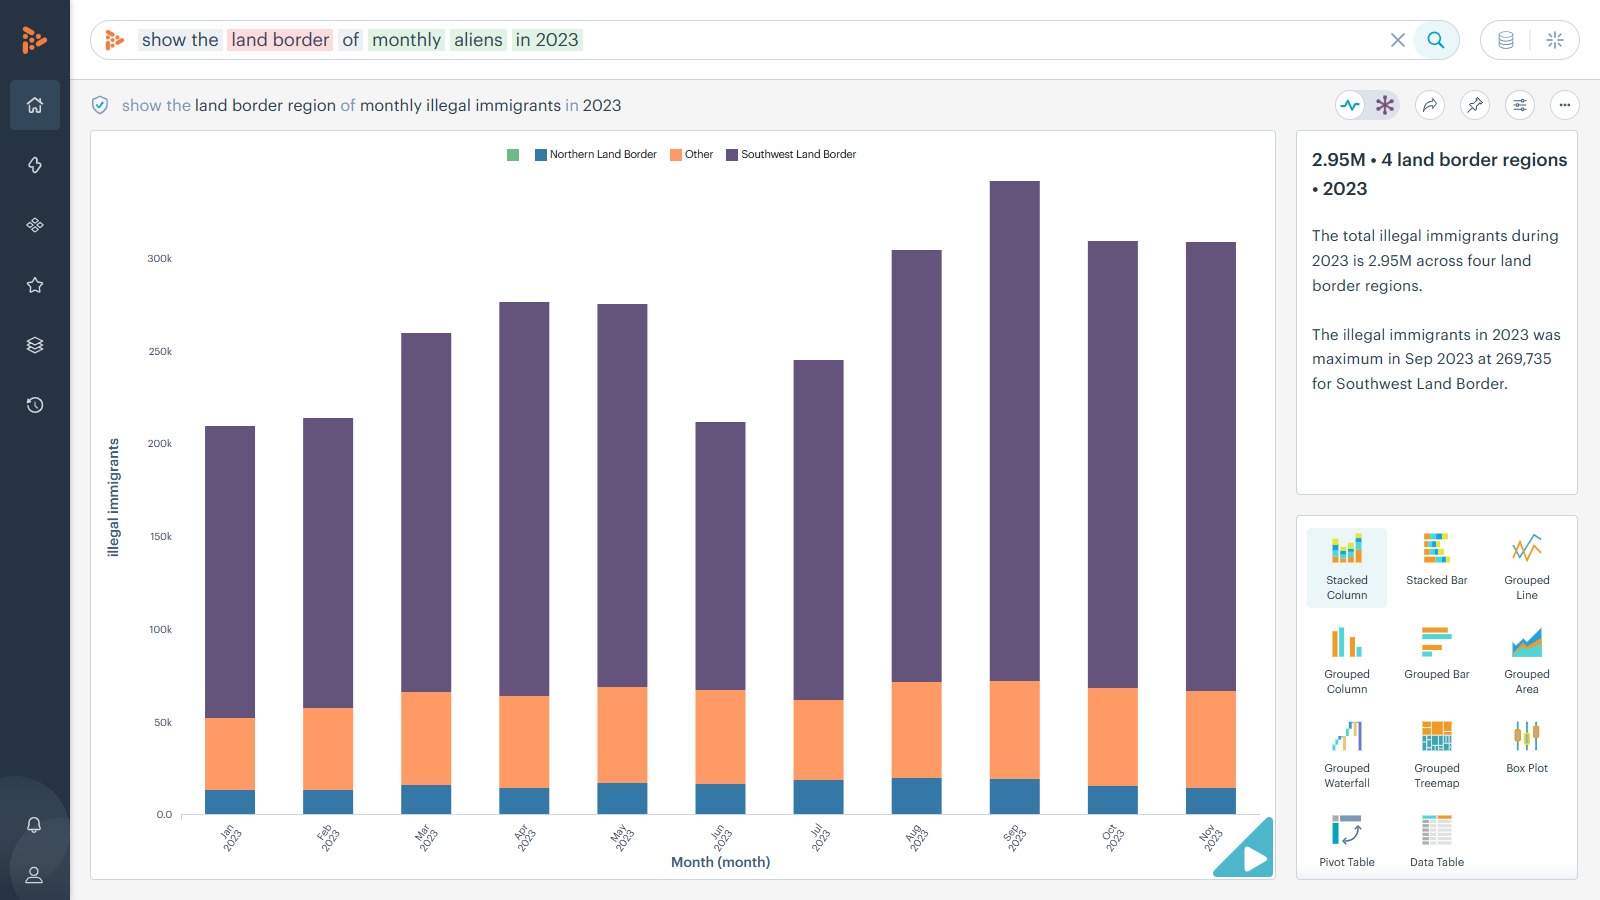
Show the land border of monthly aliens in 2023
The total illegal immigrants during 2023 is 2.95M across four land border regions. The illegal immigrants in 2023 was maximum in Sep 2023 at 269,735 for Southwest Land Border.
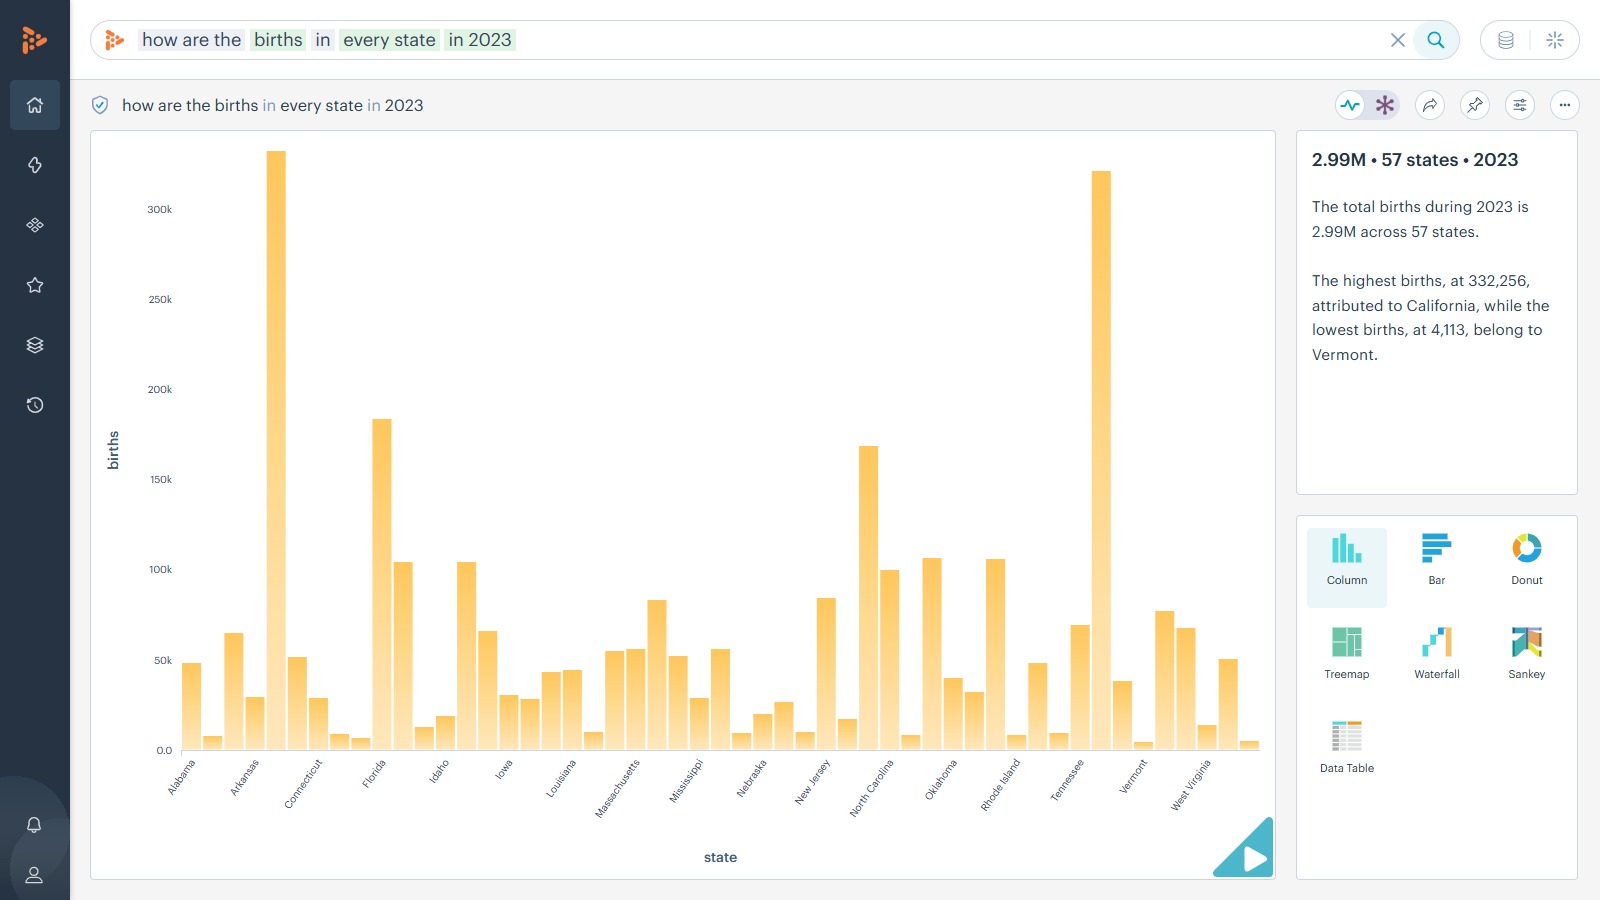
How are the births in every state in 2023
The total births during 2023 is 2.99M across 57 states. The highest births, at 332,256, attributed to California, while the lowest births, at 4,113, belong to Vermont.
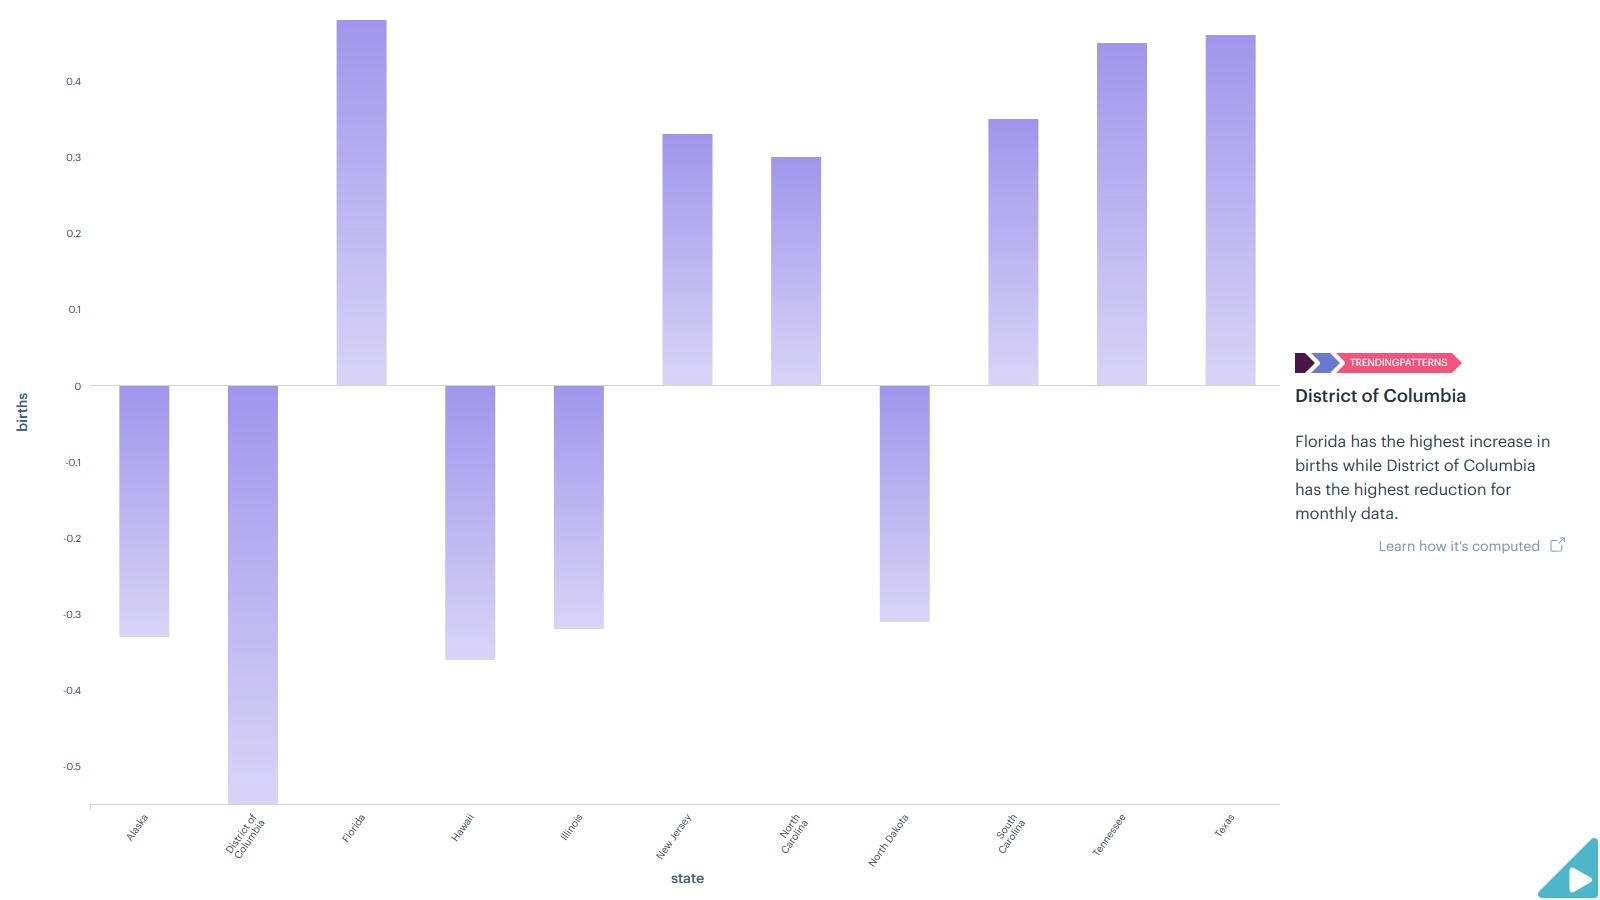
Show births across months and state in 2023
Florida has the highest increase in births while District of Columbia has the highest reduction for monthly data.
As you could see, through a user-friendly interface that includes Google-like search and YouTube-like audio-visual experiences, decision-makers at any level can receive actionable insights and recommendations. MachEye adds a new level of interactivity to data analysis with its actionable "play" button feature.
Analyze with MachEye: Try with Your Data Today!
MachEye's analytics copilot delivers intelligent search, actionable insights, and interactive stories on business data. It empowers users with conversational answers, summarized narratives, and immersive audio-visual presentations. Offering comprehensive solutions for 'what, why, and how' scenarios, it features a user-friendly interface resembling Google's search and YouTube's audio-visual experiences. Decision-makers at all levels gain actionable insights and recommendations. MachEye elevates data analysis with its interactive 'play' button.
To analyze your own dataset with MachEye, start today!
The total illegal immigrants during Jan to Nov 2023 is 2.95M, while the total births during Jan to Oct 2023 is is 2.99M. In September 2023, the highest influx of illegal immigrants occurred, reaching 341,392, surpassing the peak for that year in August 2023 at 321,526. For 2022, the highest count of illegal immigrants was in December, totaling 302,392.
The total illegal immigrants during 2023 is 2.95M across 23 citizenships. The highest illegal immigrants, at 689,164, attributed to MEXICO, while the lowest illegal immigrants, at 3,286, belong to ROMANIA.
Citizenship HAITI has the highest growth in illegal immigrants at nearly half between January 2023 and November 2023 as compared to a year ago. Citizenship NICARAGUA has the highest decline in illegal immigrants at 69.7% between January 2023 and November 2023 as compared to a year ago.
The total illegal immigrants during 2023 is 2.95M across five demographics. The illegal immigrants in 2023 was maximum in Apr 2023 at 190,828 for Single Adults.
The total illegal immigrants in 2023 is 2.95M across 57 states. The highest illegal immigrants, at 1.19M, attributed to Texas, while the lowest illegal immigrants, at 5, belong to Indiana.
The total illegal immigrants during 2023 is 2.95M across four land border regions. The illegal immigrants in 2023 was maximum in Sep 2023 at 269,735 for Southwest Land Border.
The total births during 2023 is 2.99M across 57 states. The highest births, at 332,256, attributed to California, while the lowest births, at 4,113, belong to Vermont.
Florida has the highest increase in births while District of Columbia has the highest reduction for monthly data.