About the Dataset
Yesterday, Netflix released comprehensive details revealing what people are watching, rivaled only by YouTube in terms of disclosed viewership data. We sought to analyze this dataset, encompassing viewership data from January to June of this year, as part of Netflix's 'What We Watched' report. It encompasses over 18,000 titles and approximately 100 billion hours of viewing, showcasing details such as hours watched for each title, premiere dates for Netflix original series and films, and global availability information.
MachEye's analysis delves into various trends observed during this six-month period, including the success of recently released and older content, the popularity of new series, the global reach of films across diverse genres. Netflix emphasizes that success metrics aren't solely tied to viewing hours and advises the use of the weekly Top 10 and Most Popular lists for fair comparisons between titles.
This dataset is obtained from about.netflix.com, and this article is published on 13 DEC 2023. Note that the available dataset may only be a small portion of complete set at any given point.
Automated Data Catalog with MachEye
With its low-prep/no-prep data catalog process, MachEye categorizes data into entities and attributes, identifies entity relationships, and enriches the metadata by assigning friendly names. MachEye also measures the quality of data across multiple parameters such as clarity, completeness, consistency, integrity, interpretability, timeliness and uniqueness and scores it on a data quality index. The lower the score, the higher the data quality.

Data Quality Index
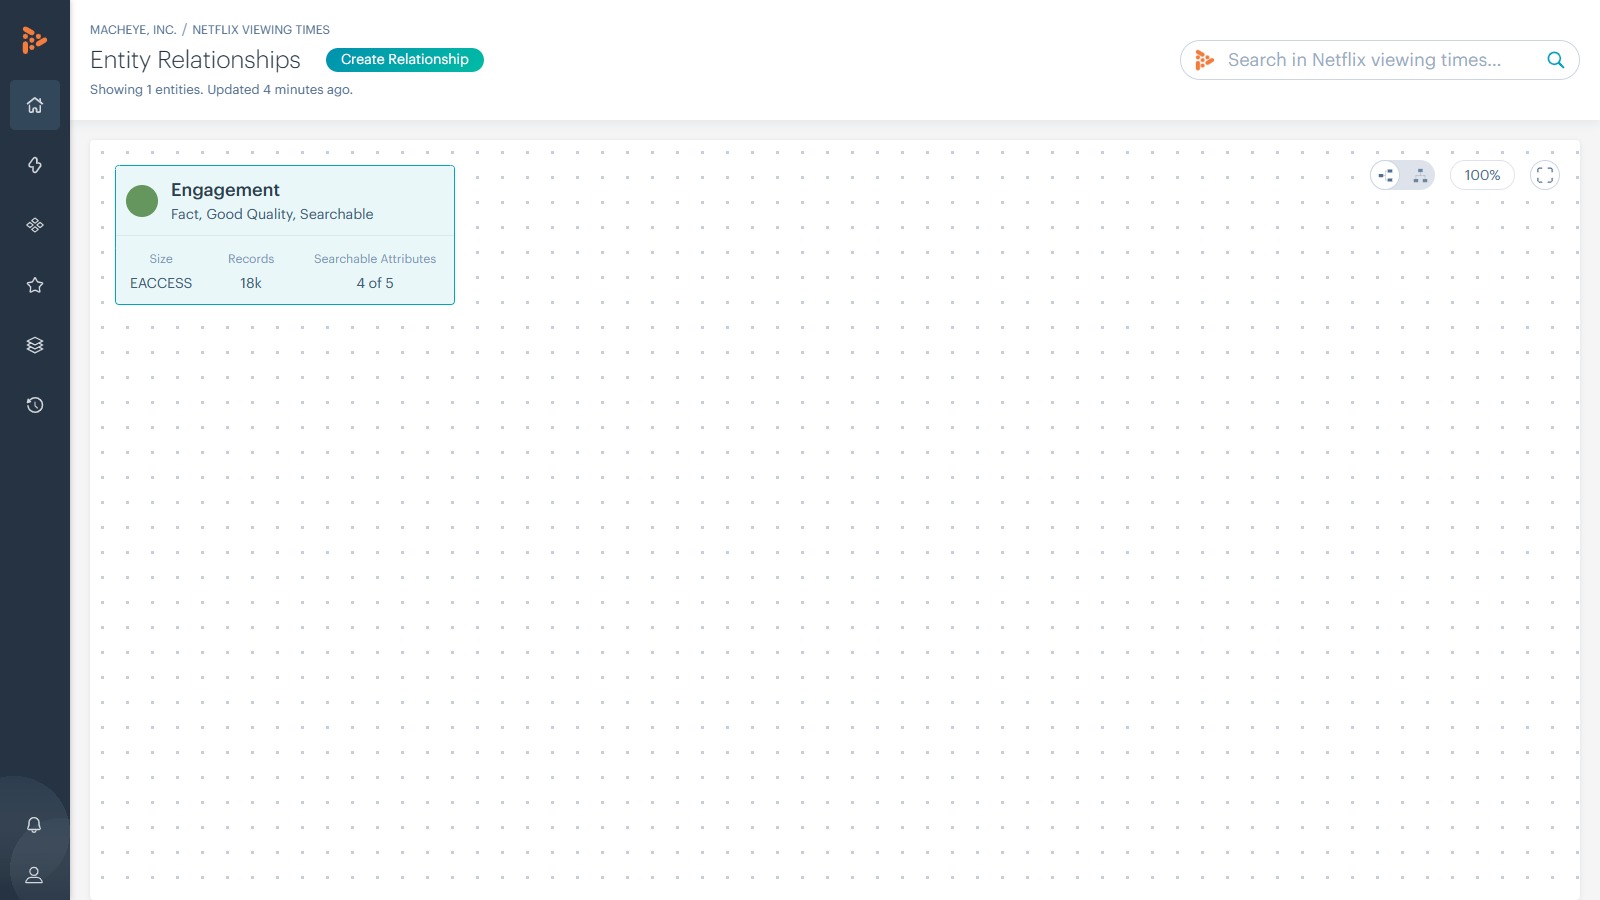
Entity Relationships
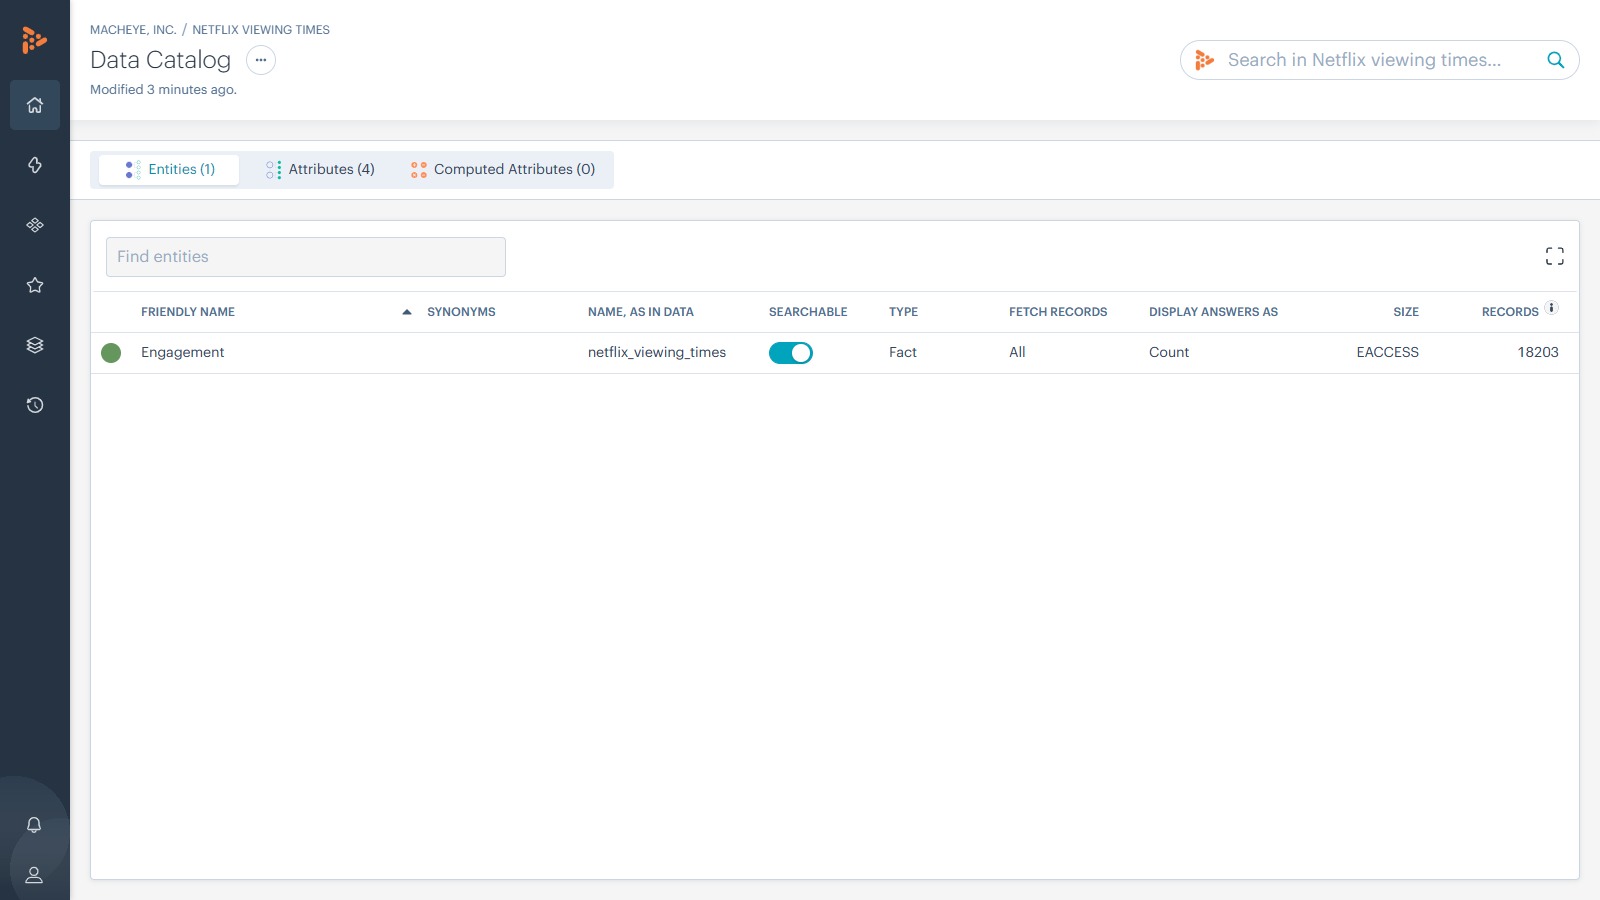
Data Catalog
Dataset Insights from MachEye
Here are some interesting answers to questions and insights presented by MachEye on this dataset. These answers and insights are presented in the form of interactive charts, pivot tables, text narratives, and audio-visual data stories.
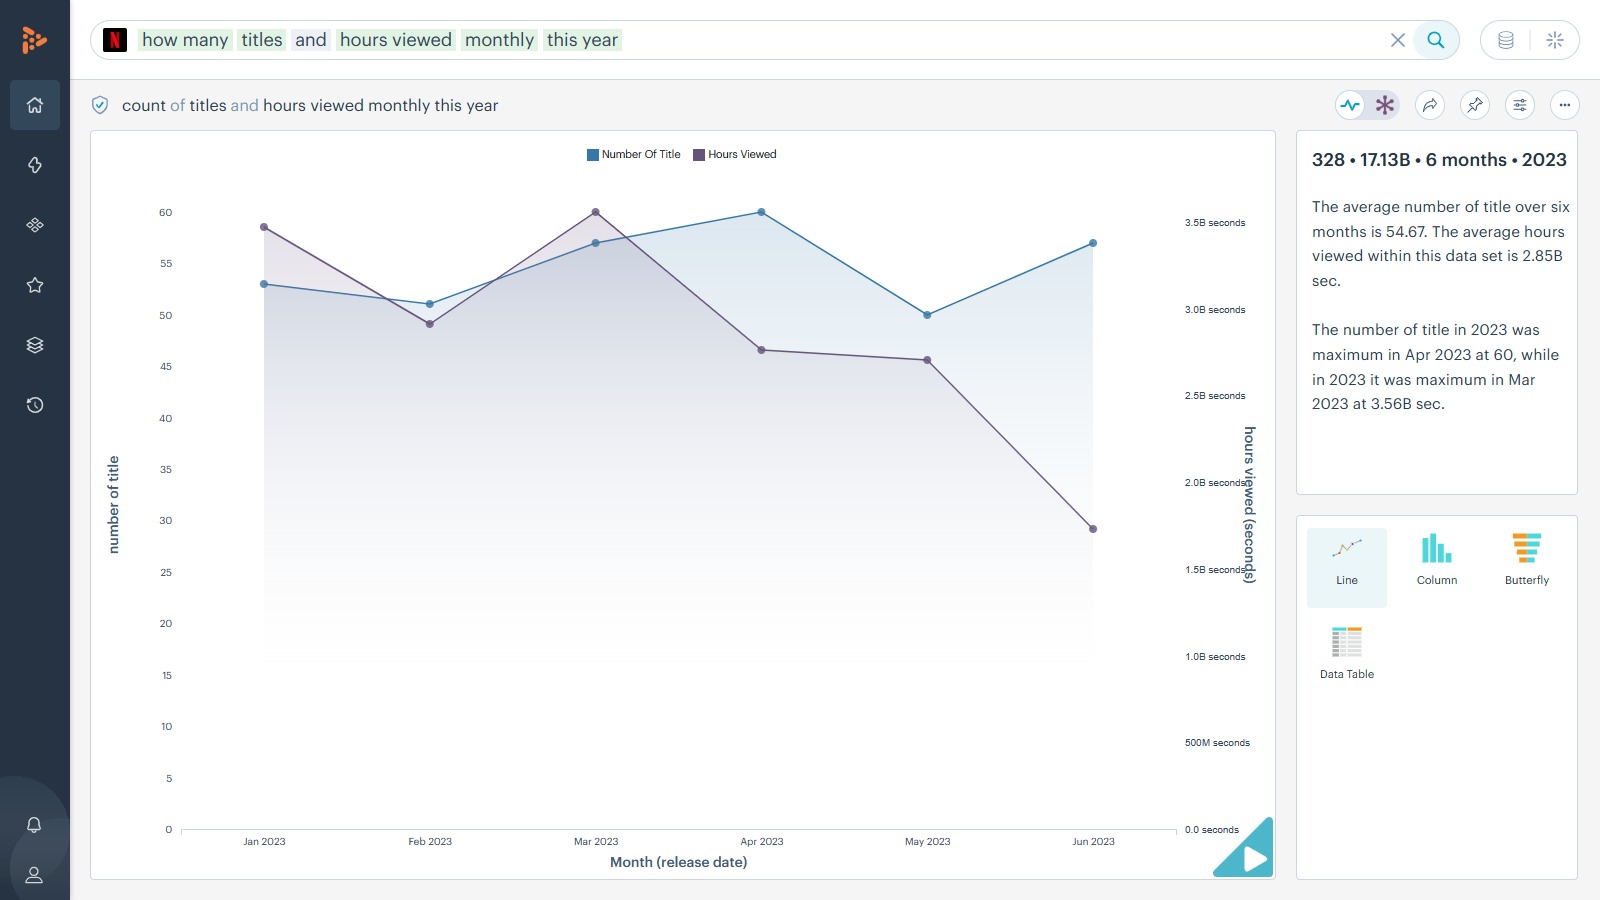
How many titles and hours viewed monthly this year?
The average number of title over six months is 54.67. The average hours viewed within this data set is 2.85B sec. The number of titles in 2023 was maximum in Apr 2023 at 60, while in 2023 it was maximum in Mar 2023 at 3.56B sec.
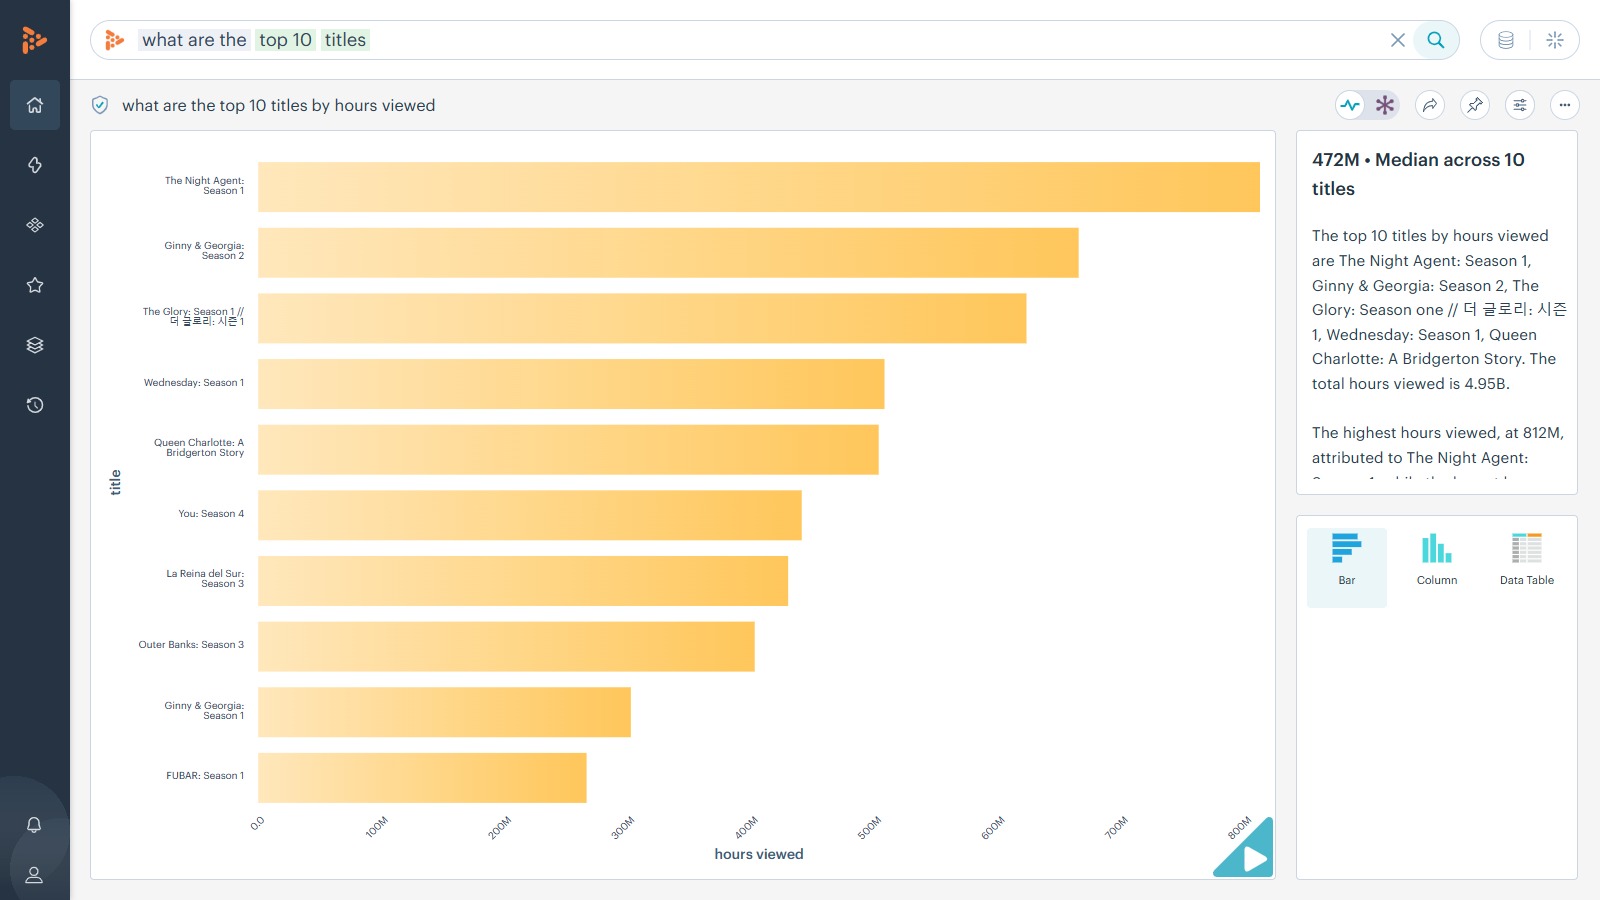
What are the top 10 titles?
The top 10 titles by hours viewed are The Night Agent: Season 1, Ginny & Georgia: Season 2, The Glory: Season one, Wednesday: Season 1, Queen Charlotte: A Bridgerton Story. The total hours viewed is 4.95B hours. The highest hours viewed, at 812M hours, attributed to The Night Agent: Season 1, while the lowest hours viewed, at 266M hours, belong to FUBAR: Season 1.
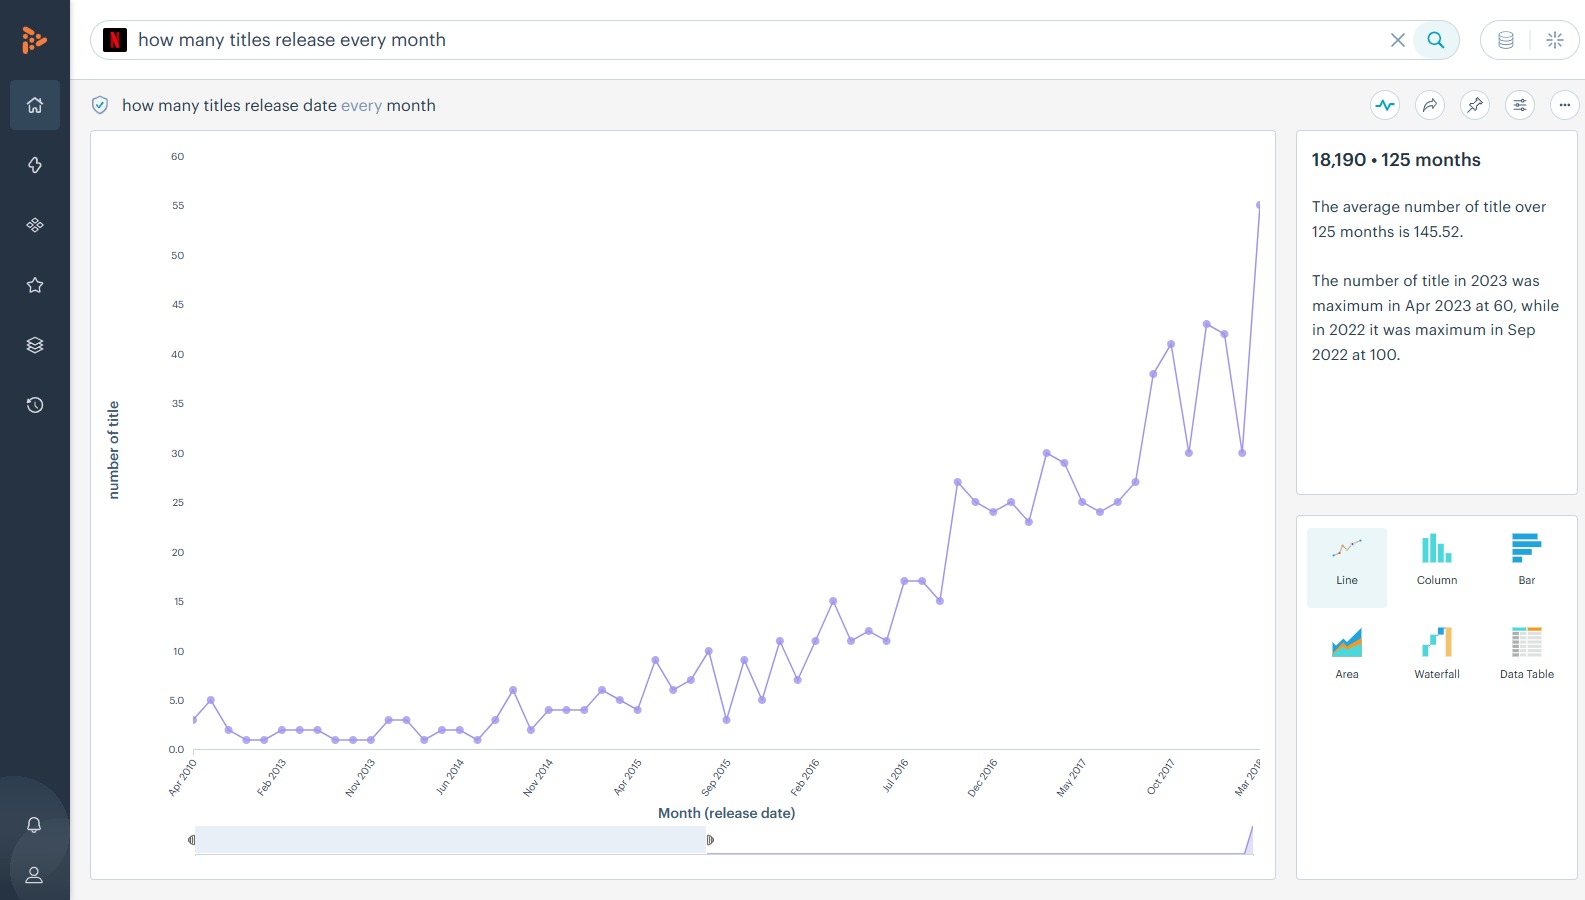
How many titles release every month
The average number of title over 125 months is 145.52. The number of title in 2023 was maximum in Apr 2023 at 60, while in 2022 it was maximum in Sep 2022 at 100.
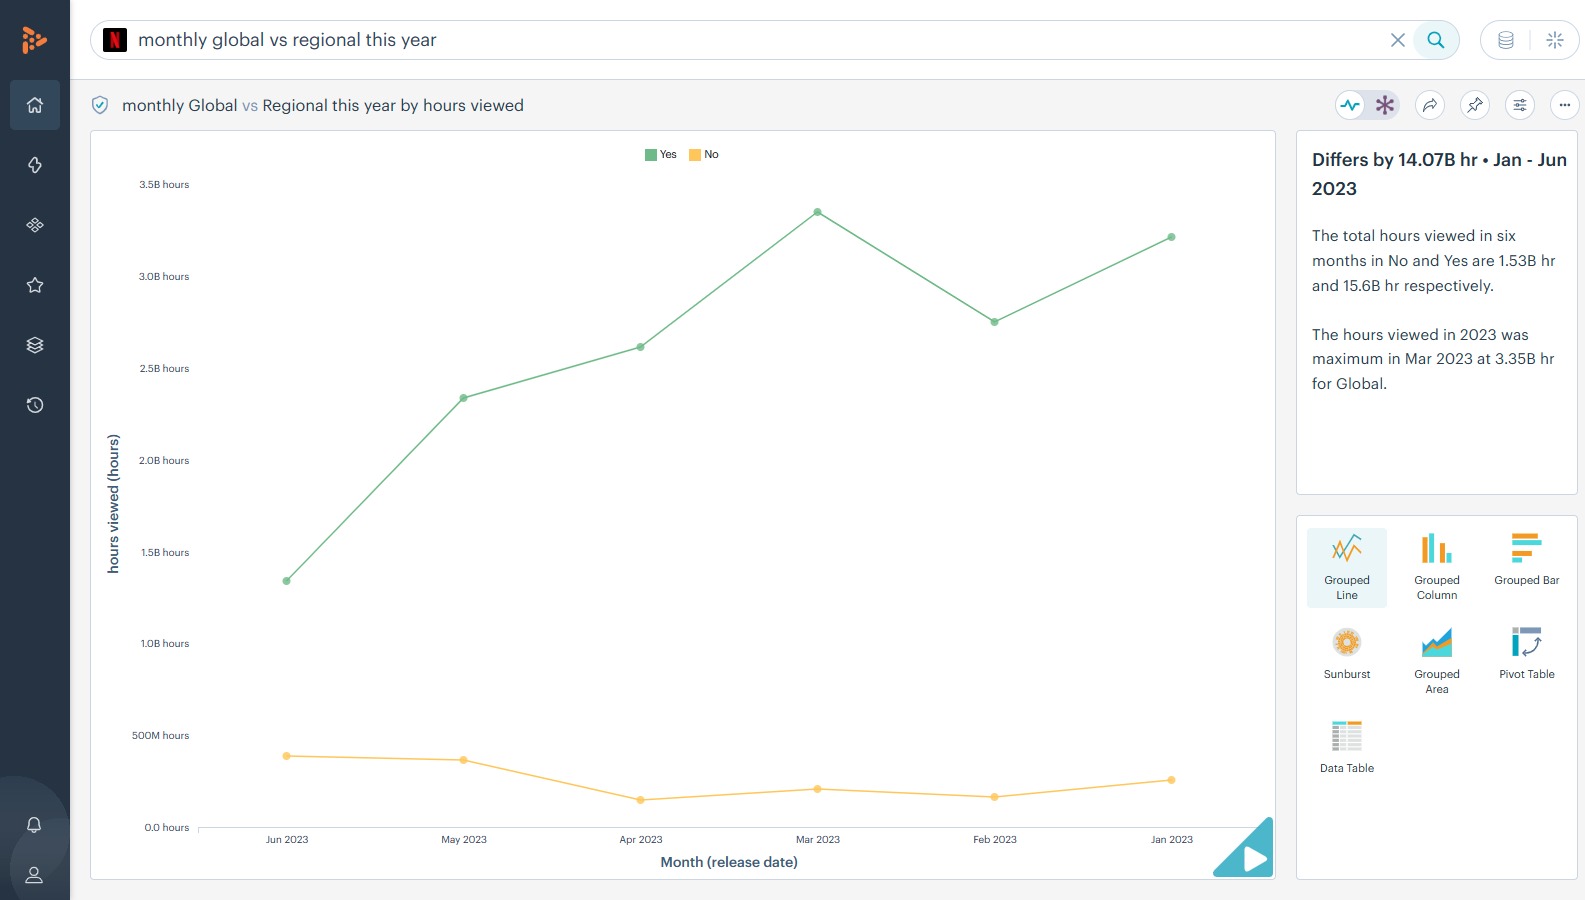
monthly global vs regional this year
The total hours viewed in six months in No and Yes are 1.53B hours and 15.6B hours respectively. The hours viewed in 2023 was maximum in Mar 2023 at 3.35B hours for Global.
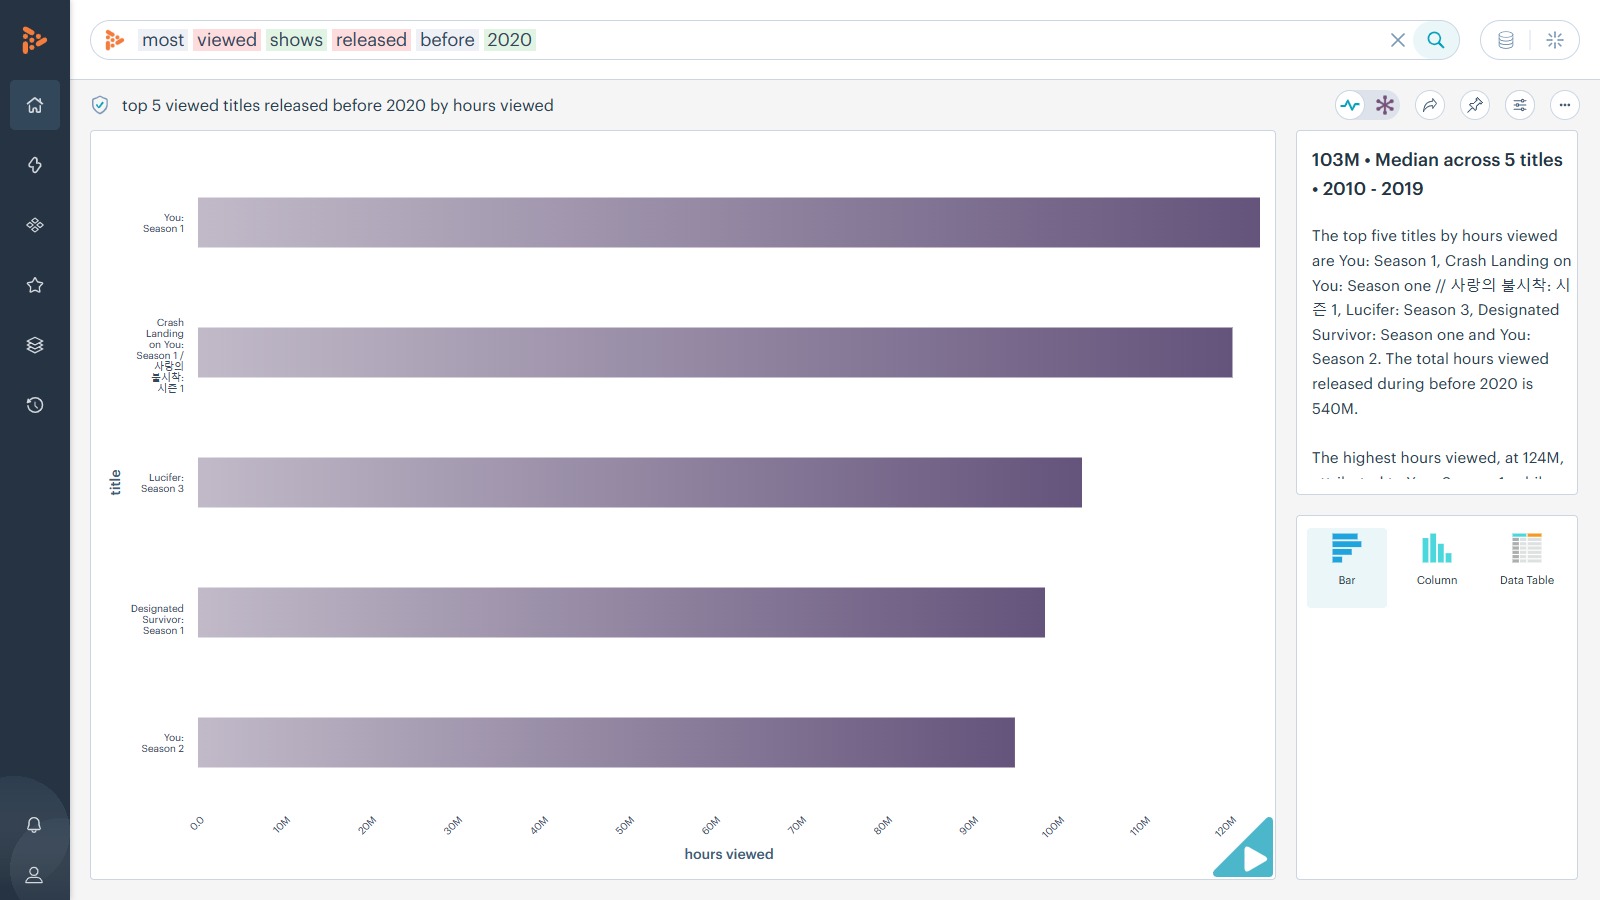
most viewed shows released before 2020
The top five titles by hours viewed are You: Season 1, Crash Landing on You: Season one, Lucifer: Season 3, Designated Survivor: Season one and You: Season 2. The total hours viewed released during before 2020 is 540M hours. The highest hours viewed, at 124M hours, attributed to You: Season 1, while the lowest hours viewed, at 95M hours, belong to You: Season 2.
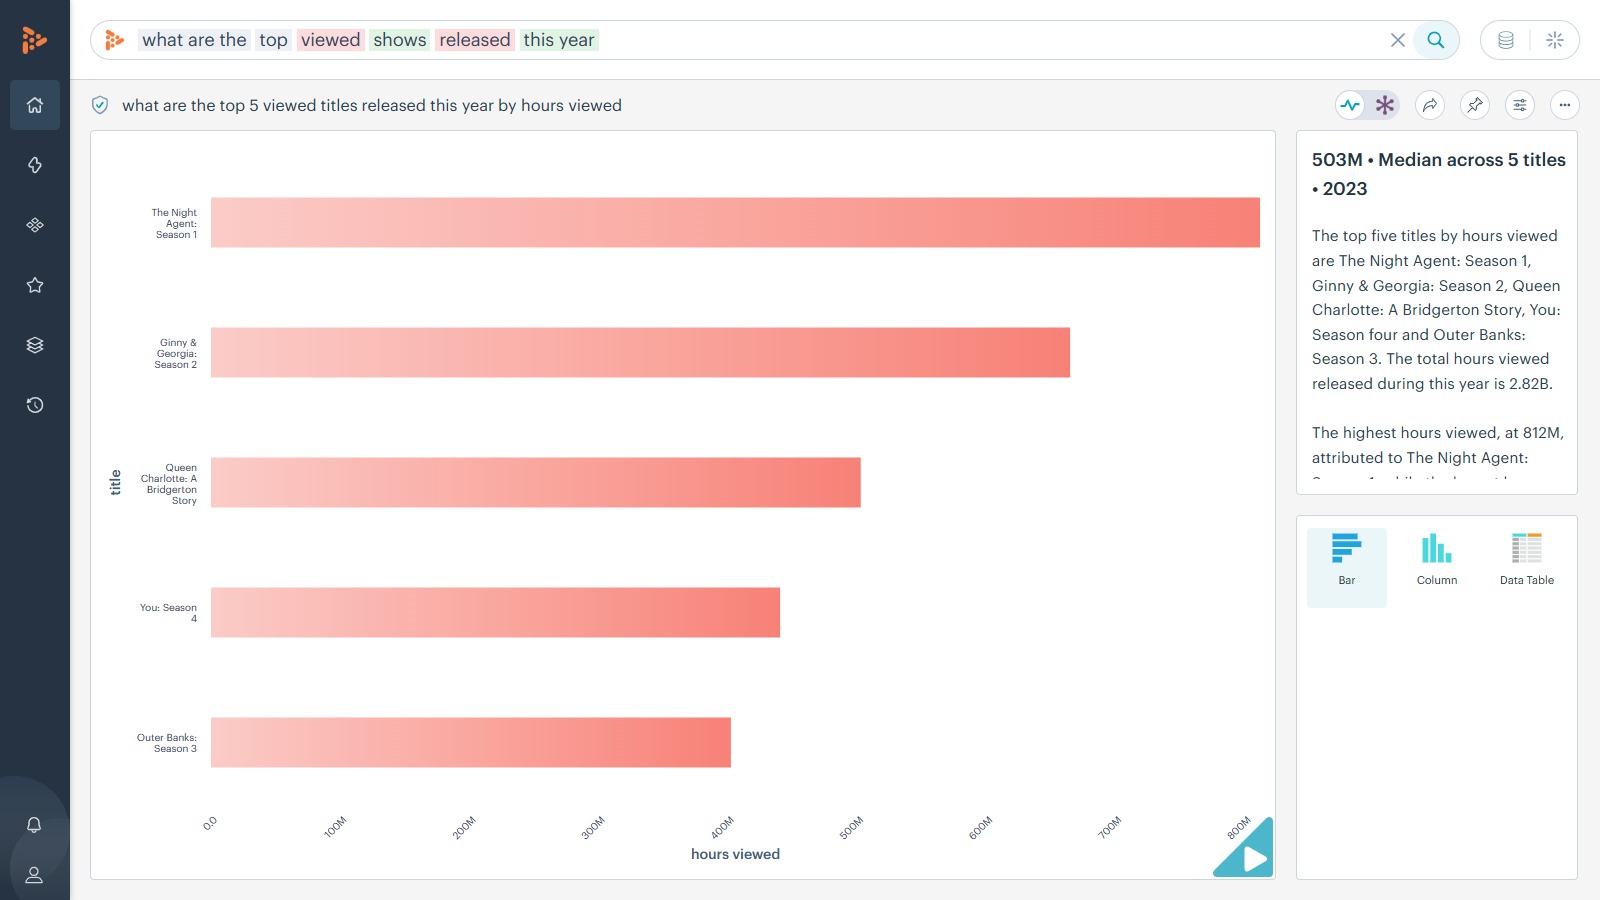
What are the most viewed shows released this year
The top five titles by hours viewed are The Night Agent: Season 1, Ginny & Georgia: Season 2, Queen Charlotte: A Bridgerton Story, You: Season four and Outer Banks: Season 3. The total hours viewed released during this year is 2.82B hours. The highest hours viewed, at 812M hours, attributed to The Night Agent: Season 1, while the lowest hours viewed, at 402M hours, belong to Outer Banks: Season 3.
As you could see, through a user-friendly interface that includes Google-like search and YouTube-like audio-visual experiences, decision-makers at any level can receive actionable insights and recommendations. MachEye adds a new level of interactivity to data analysis with its actionable "play" button feature.
Analyze with MachEye: Try with Your Data Today!
MachEye's analytics copilot delivers intelligent search, actionable insights, and interactive stories on business data. It empowers users with conversational answers, summarized narratives, and immersive audio-visual presentations. Offering comprehensive solutions for 'what, why, and how' scenarios, it features a user-friendly interface resembling Google's search and YouTube's audio-visual experiences. Decision-makers at all levels gain actionable insights and recommendations. MachEye elevates data analysis with its interactive 'play' button.
To analyze your own dataset with MachEye, start today!
The average number of title over six months is 54.67. The average hours viewed within this data set is 2.85B sec. The number of titles in 2023 was maximum in Apr 2023 at 60, while in 2023 it was maximum in Mar 2023 at 3.56B sec.
The top 10 titles by hours viewed are The Night Agent: Season 1, Ginny & Georgia: Season 2, The Glory: Season one, Wednesday: Season 1, Queen Charlotte: A Bridgerton Story. The total hours viewed is 4.95B hours. The highest hours viewed, at 812M hours, attributed to The Night Agent: Season 1, while the lowest hours viewed, at 266M hours, belong to FUBAR: Season 1.
The average number of title over 125 months is 145.52. The number of title in 2023 was maximum in Apr 2023 at 60, while in 2022 it was maximum in Sep 2022 at 100.
The total hours viewed in six months in No and Yes are 1.53B hours and 15.6B hours respectively. The hours viewed in 2023 was maximum in Mar 2023 at 3.35B hours for Global.
The top five titles by hours viewed are You: Season 1, Crash Landing on You: Season one, Lucifer: Season 3, Designated Survivor: Season one and You: Season 2. The total hours viewed released during before 2020 is 540M hours. The highest hours viewed, at 124M hours, attributed to You: Season 1, while the lowest hours viewed, at 95M hours, belong to You: Season 2.
The top five titles by hours viewed are The Night Agent: Season 1, Ginny & Georgia: Season 2, Queen Charlotte: A Bridgerton Story, You: Season four and Outer Banks: Season 3. The total hours viewed released during this year is 2.82B hours. The highest hours viewed, at 812M hours, attributed to The Night Agent: Season 1, while the lowest hours viewed, at 402M hours, belong to Outer Banks: Season 3.