About the Dataset
This dataset presents the significant rise in tourism in recent decades, driven by increased aviation accessibility for international travel. Prior to the COVID-19 pandemic, the number of international visits had more than doubled since 2000. The blog emphasizes the dual significance of tourism for both travelers and the host countries. Traveling enhances understanding and appreciation of diverse cultures, while many countries heavily rely on tourism as a major source of income. However, tourism also brings about negative effects such as contributing to carbon emissions and potentially harming local environments and cultures. The blog offers data and visualizations to explore the evolution and present status of global tourism.
Here's a brief summary of the data.
- Entity: This column indicates the region where the international tourist arrivals are recorded.
- International Tourist Arrivals: This column represents the number of international tourists that arrived in the respective region for the given year.
- Year: This column specifies the year in which the international tourist arrivals data is recorded.
The dataset covers the years from 1995 to 2021 and includes data for different regions such as Africa, Americas, East Asia and the Pacific, Europe, Middle East, Not classified, and South Asia.
This data could be used to analyze the trends and changes in international tourism over the years and across different regions, which could be particularly relevant when discussing the growth and impact of tourism in your blog post.
Here are the sample queries that can be queried on this dataset.
- What is the overall trend in international tourist arrivals across all regions from 1995 to 2021?
- Which year had the highest international tourist arrivals globally?
- Which year experienced the lowest international tourist arrivals globally?
- How have international tourist arrivals in Europe evolved over the years?
- Which region saw the highest percentage increase in international tourist arrivals between 2000 and 2010?
- In which region did international tourist arrivals decline the most during the COVID-19 pandemic in 2020?
- Compare the international tourist arrivals for the Americas and Asia in the year 2005.
- What was the difference in international tourist arrivals between Africa and the Middle East in the year 2018?
- How did South Asia's international tourist arrivals change between 2010 and 2015?
- Calculate the average annual growth rate of international tourist arrivals for each region.
- Which region had the highest average growth rate of international tourist arrivals between 2000 and 2010?
- How did international tourist arrivals change globally in the year 2020 compared to 2019?
- What was the percentage decrease in international tourist arrivals in Europe during the COVID-19 pandemic in 2020?
- Identify the peak year for international tourist arrivals in the Americas.
- In which year did East Asia and the Pacific experience the highest number of international tourist arrivals?
- Analyze the international tourist arrivals in the Middle East in the year 2005.
- Compare the international tourist arrivals in Africa and South Asia in the year 2015.
- Compare the international tourist arrivals in 2019 and 2021 for each region.
- Which regions experienced a decrease in international tourist arrivals from 2019 to 2021?
This dataset is obtained from ourworldindata.org, and this article is published on 19 Aug 2023. Note that the available dataset may only be a small portion of complete set at any given point.
Automated Data Catalog with MachEye
With its low-prep/no-prep data catalog process, MachEye categorizes data into entities and attributes, identifies entity relationships, and enriches the metadata by assigning friendly names. MachEye also measures the quality of data across multiple parameters such as clarity, completeness, consistency, integrity, interpretability, timeliness and uniqueness and scores it on a data quality index. The lower the score, the higher the data quality.

Data Quality Index

Entity Relationships
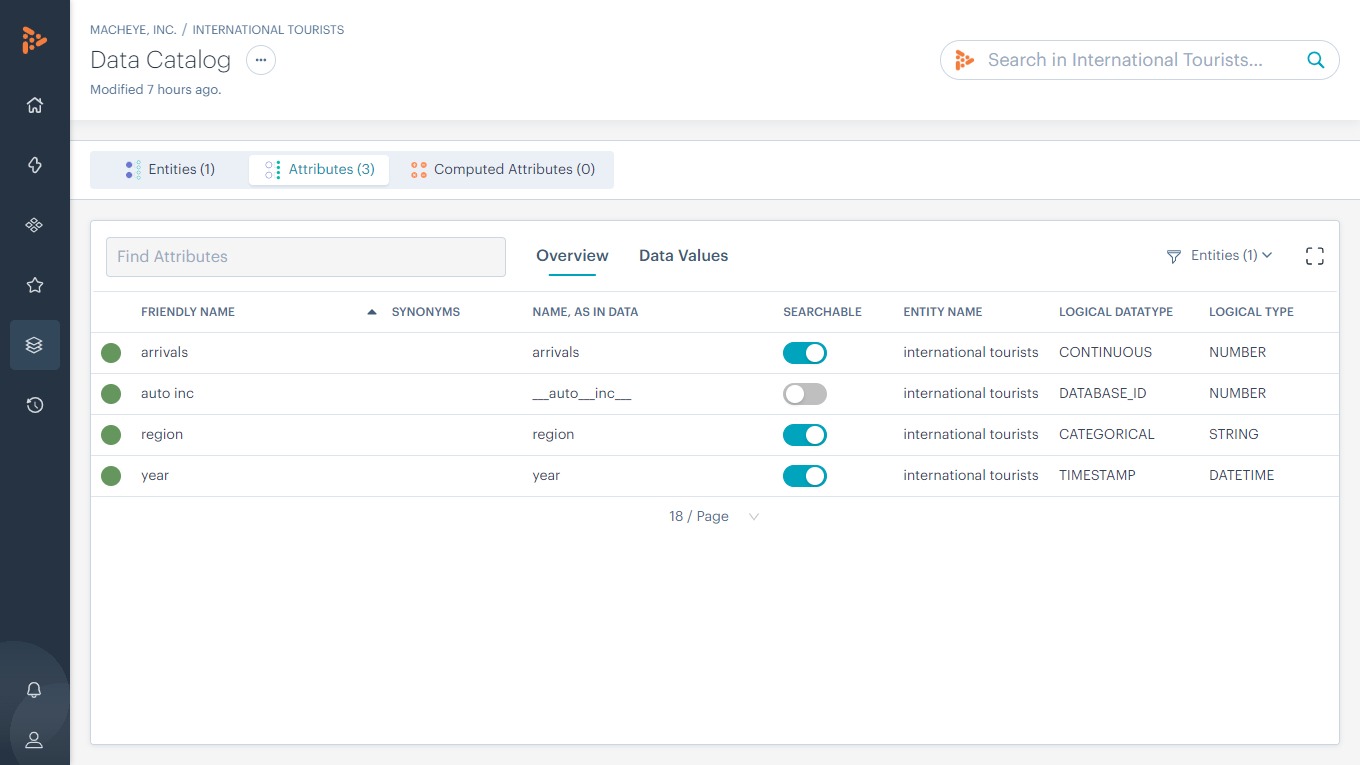
Data Catalog
Dataset Insights from MachEye
Here are some interesting answers to questions and insights presented by MachEye on this dataset. These answers and insights are presented in the form of interactive charts, pivot tables, text narratives, and audio-visual data stories.
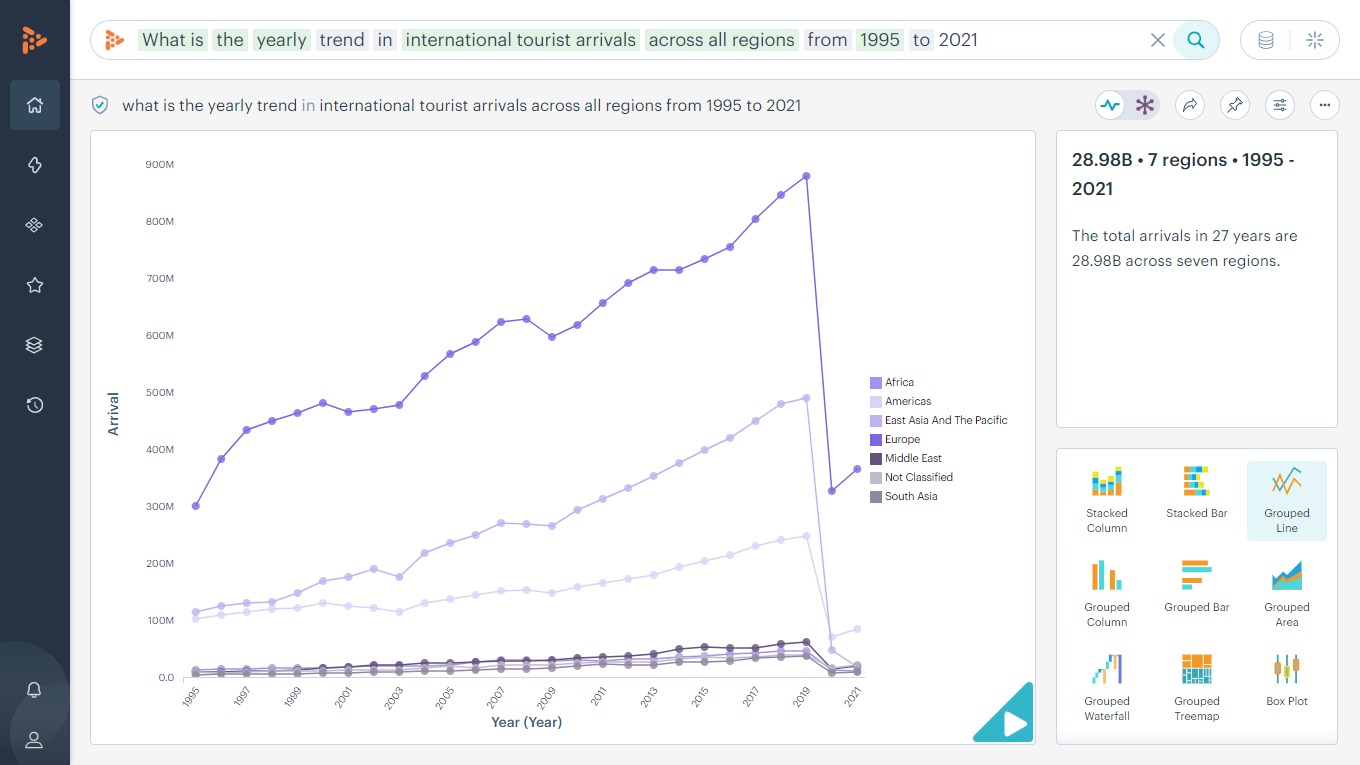
What is the yearly trend in international tourist arrivals across all regions from 1995 to 2021
The total arrivals in 27 years are 28.98B across seven regions. Europe gained the highest volume of interntional tourists in this time period.
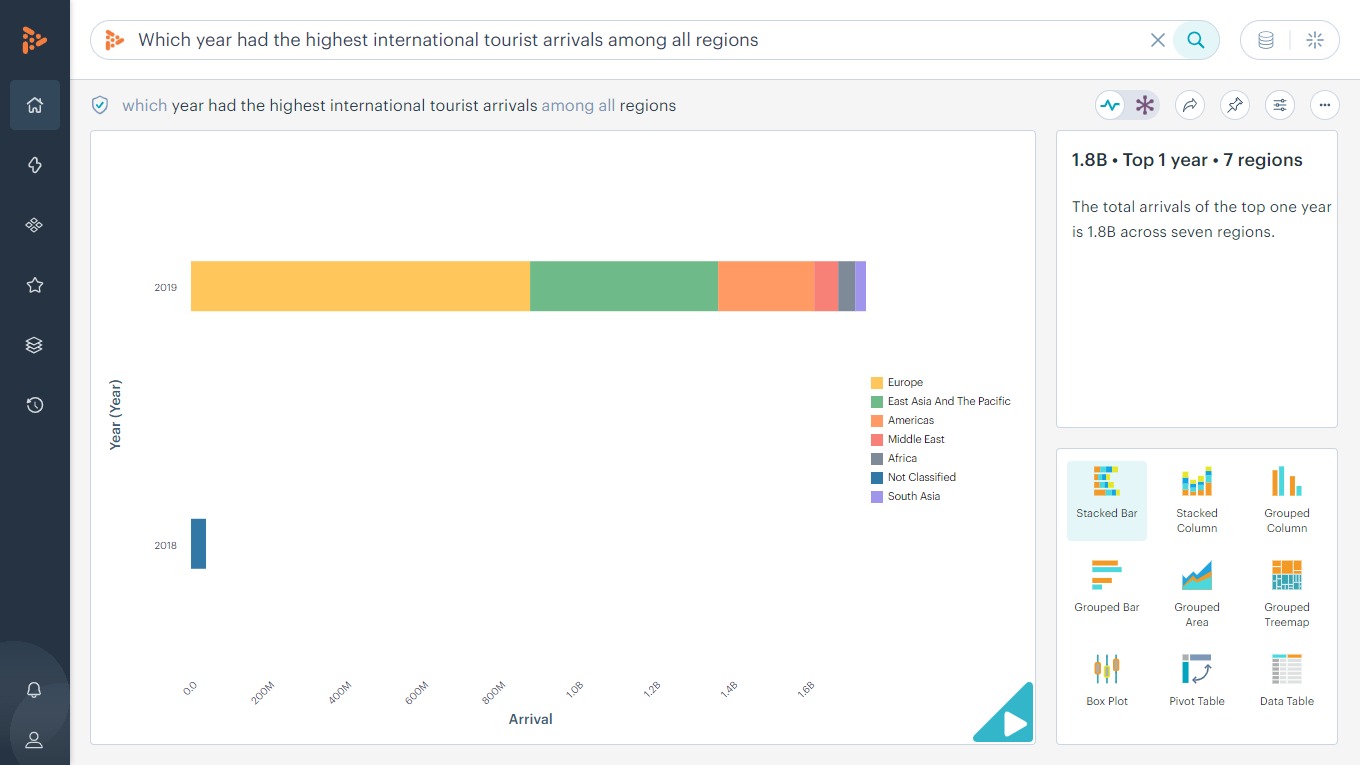
Which year had the highest international tourist arrivals among all regions
The total arrivals in 2019 is the highest at 1.8B across all years.
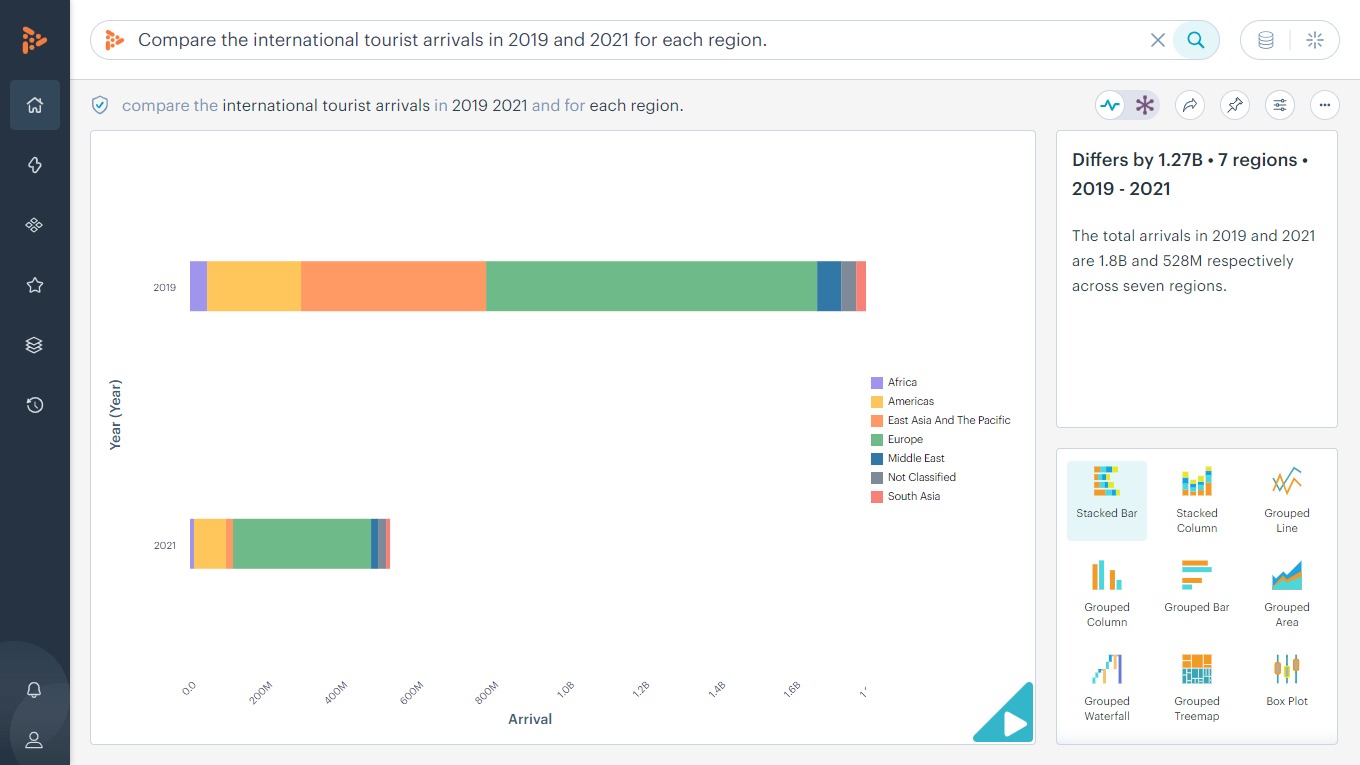
Compare the international tourist arrivals in 2019 and 2021 for each region.
The total arrivals in 2019 and 2021 are 1.8B and 528M respectively across seven regions.
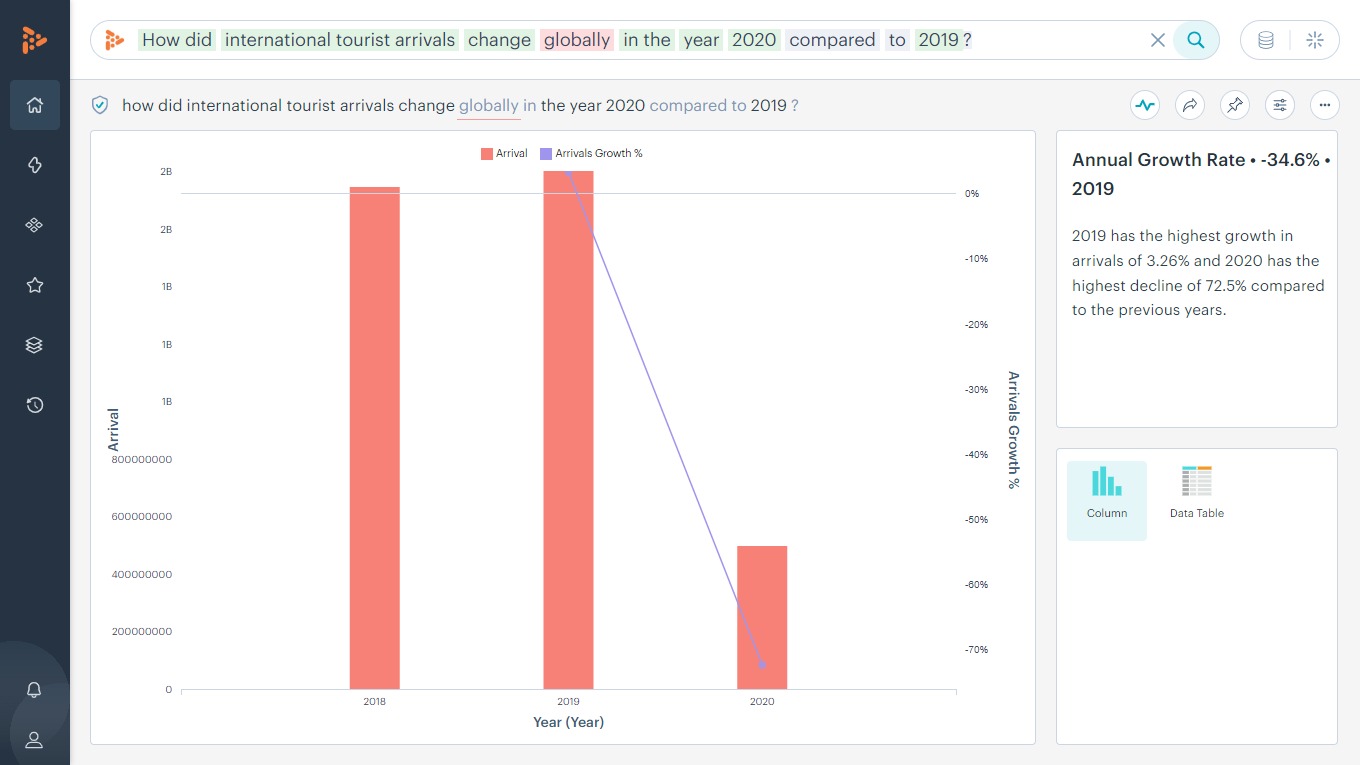
How did international tourist arrivals change globally in the year 2020 compared to 2019?
2019 has the highest growth in arrivals of 3.26% and 2020 has the highest decline of 72.5% compared to the previous years.
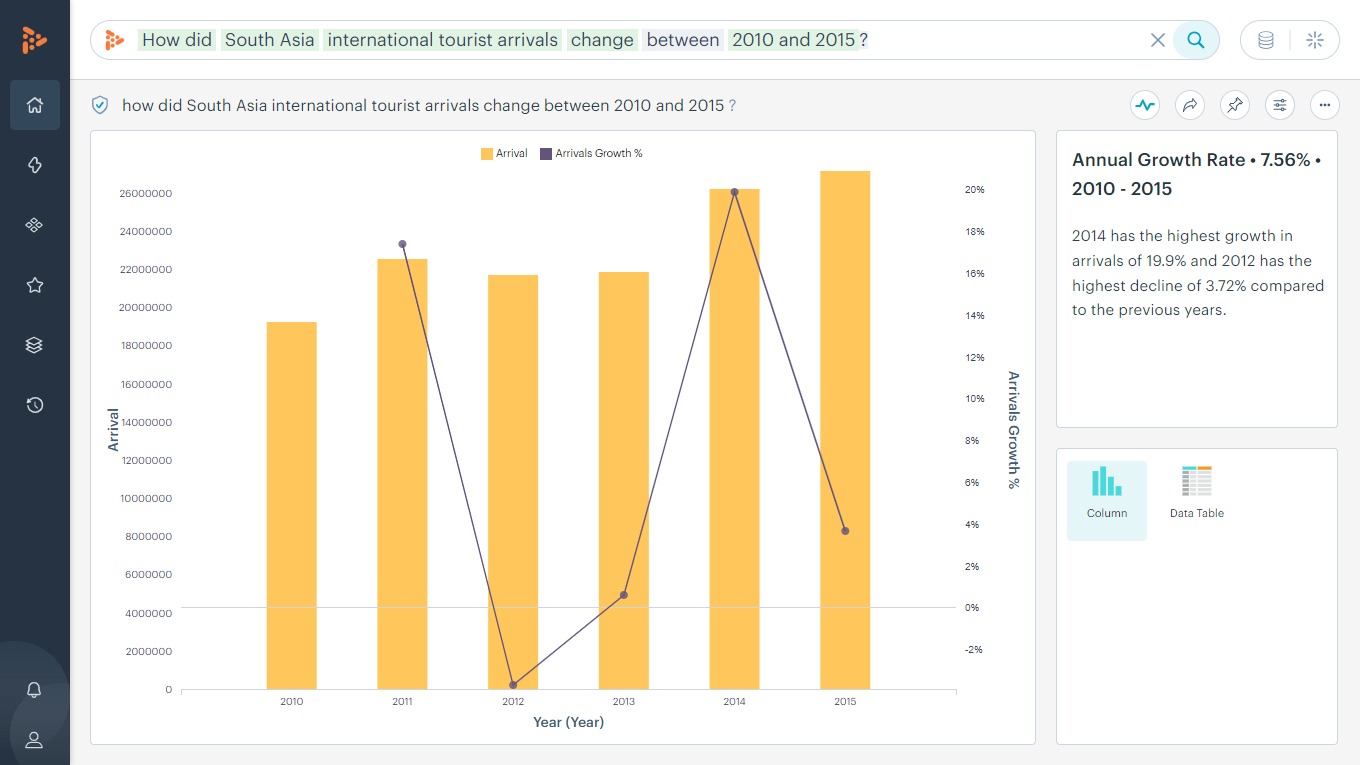
How did South Asia international tourist arrivals change between 2010 and 2015?
South Asia had an overall growth of 7.56% between 2010 and 2015. The year 2014 has the highest growth in arrivals of 19.9% and 2012 has the highest decline of 3.72% compared to the previous years.
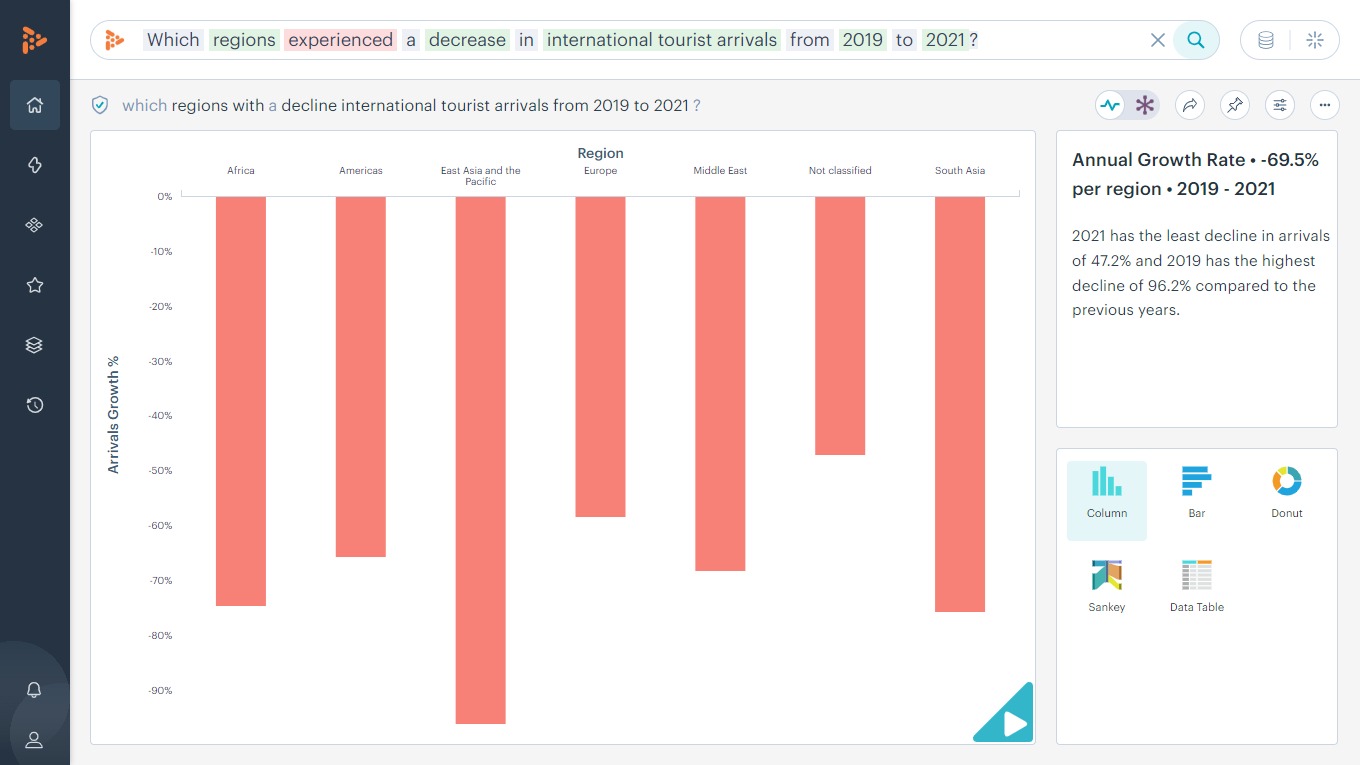
Which regions experienced a decrease in international tourist arrivals from 2019 to 2021?
Average Annual Growth Rate was -69.5% across all region in 2019 to 2021. The year 2021 has the least decline in arrivals of 47.2% and 2019 has the highest decline of 96.2% compared to the previous years.
As you could see, through a user-friendly interface that includes Google-like search and YouTube-like audio-visual experiences, decision-makers at any level can receive actionable insights and recommendations. MachEye adds a new level of interactivity to data analysis with its actionable "play" button feature.
Analyze with MachEye: Try with Your Data Today!
MachEye's analytics copilot delivers intelligent search, actionable insights, and interactive stories on business data. It empowers users with conversational answers, summarized narratives, and immersive audio-visual presentations. Offering comprehensive solutions for 'what, why, and how' scenarios, it features a user-friendly interface resembling Google's search and YouTube's audio-visual experiences. Decision-makers at all levels gain actionable insights and recommendations. MachEye elevates data analysis with its interactive 'play' button.
To analyze your own dataset with MachEye, start today!
The total arrivals in 27 years are 28.98B across seven regions. Europe gained the highest volume of interntional tourists in this time period.
The total arrivals in 2019 is the highest at 1.8B across all years.
The total arrivals in 2019 and 2021 are 1.8B and 528M respectively across seven regions.
2019 has the highest growth in arrivals of 3.26% and 2020 has the highest decline of 72.5% compared to the previous years.
South Asia had an overall growth of 7.56% between 2010 and 2015. The year 2014 has the highest growth in arrivals of 19.9% and 2012 has the highest decline of 3.72% compared to the previous years.
Average Annual Growth Rate was -69.5% across all region in 2019 to 2021. The year 2021 has the least decline in arrivals of 47.2% and 2019 has the highest decline of 96.2% compared to the previous years.