
What is Search-Driven Analytics
by Ramesh Panuganty, Founder & CEO
What is Search-Driven Analytics
by Ramesh Panuganty, Founder & CEO
The humble search box is a ubiquitous element present in most apps and websites we use in our everyday lives. It enables us to use the simplest language for asking questions. It provides an easy way to access information and gain insights faster. This same search box opens the gateway to enterprise data, makes it accessible for everyone, and extracts valuable insights by enabling search-driven analytics.
Search-driven analytics empowers business users with the ability to ask questions using a search box for getting insights from their enterprise data in the form of visualizations and summaries. It is useful for all types of users, especially the non-technical business users who use insights on a daily basis to make decisions. It offers an effective way to explore data and perform ad hoc analysis as and when any requirements and questions arise.
What is the role of natural language processing in search-driven analytics?
With traditional BI, business users have to use specific keywords while searching to get the right answers. They have to first know and remember the right keywords, and then form the search query using those keywords. This takes significant time and limits their ability to ask the questions the way they think of them naturally.
Natural Language Processing (NLP) makes search-driven analytics more intuitive and effortless. Instead of keywords, users can use simple human language as they naturally speak or write. They can directly enter questions in the search box such as, “How much did the sales grow this year?” or “What are the top 5 outlets by sales?” Thanks to NLP, modern analytics platforms are able to understand users’ requests, convert it into machine-understandable syntax, and process them correctly to get the exact answers.
Why does search-driven and natural language analytics matter?
When organizations extend analytics capabilities to their employees and customers, they empower them with insights that help them reach their goals better. Gartner, in their 2022 trends, predicts that leaders should prioritize data literacy and put in place strategies to address the scarcity of data and analytics talent. Organizations that provide self-service analytics capabilities will have a significant advantage over their competitors.
Search-driven analytics is one of the key elements of self-service analytics. It simplifies analytics and makes it accessible for everyone. Natural language support makes interacting with data more conversational with questions like “Show me annual sales” or “Tell me about the most sold product in the West region”. Search-driven analytics makes business users comfortable in interacting with data. This increases their confidence in performing analysis themselves and relying on actual insights to make decisions. Analytics platforms that offer search-driven analytics and natural language processing can help organizations increase analytics adoption, improve customer engagement, and achieve data literacy throughout the organization.
What questions can users ask using search-driven analytics?
Search-driven analytics makes users more human and conversational while exploring data for insights. The following are some questions that users can ask in the search box to get instant insights.
Sales
- What are the total sales of top 5 account reps?
- How much did the sales grow in California this year?
- Compare the monthly sales of cappuccino and latte.
- Why did sales increase in 2021?
- Top customer segments for sports shoes
Marketing
- What are the monthly spends on all channels?
- Show me the most used coupon codes by transactions
- What were the marketing budgets for social media for last 10 years
- Compare leads generated by Instagram and Twitter last month
- Which states had low sales during campaign XYZ?
Customer Success
- What was the customer churn last quarter?
- What was the renewal rate last month for Premium pack?
- What is the annual recurring revenue?
- Show me customer satisfaction score for running shoes vs. hiking shoes
- Which are the top preferred services by customers?
What types of analysis can be performed using a search-driven analytics platform?
In addition to fetching answers, search-driven analytics platforms can help users perform various analyses to extract deep insights. The following are some important types of analysis.
- Anomaly Detection: Anomalies are events that deviate from the normal course and are irregular in nature. Detecting anomalies involves separating the deviant entities from the regular ones. Understanding anomalies and outliers can help spot irregularities in business events and spot potential red flags in advance.
- Trends Forecasting: Identifying a trend or pattern over time can help understand the behavior of entities. Trends also help in predicting how these entities will behave in future. Forecasting enables users to estimate and prepare plans for managing activities in future.
- Root Cause Analysis or Why Analysis: Understanding what happened or changed is incomplete without unearthing the “why” or the root cause behind a change. Why analysis identifies all the driving factors and helps determine the most influencing one, so that users become aware and can take appropriate actions.
- Comparisons: Comparing a variable over time and other parameters can help spot growth, stagnancy, and decline. Comparing different variables can help identify similarities and differences in them. This enables users to keep track of different variables, identify the best performing and the least performing ones, and revise their strategies accordingly.
- Cluster Identification: It is easier to study the traits of elements that are similar in nature. Cluster identification helps in grouping similar entities together and categorizing them to understand their qualities. This enables users to create customized strategies for each cluster and take focused actions for maximum impact.
- Patterns and Correlations: Understanding the relationship between different variables can help identify how they influence each other. Such correlations can help users learn how they can be controlled to achieve a desired result. A study of seasonal occurrences can help users identify and study recurring patterns which then can be used to create strategies.
Search-driven analytics in action: An example
We used MachEye’s search-driven analytics platform to explore the public data provided by National Park Service (NPS) for the lockdown year of 2020. We asked a simple question using MachEye about park visitors: “visitors at top 25 national parks”
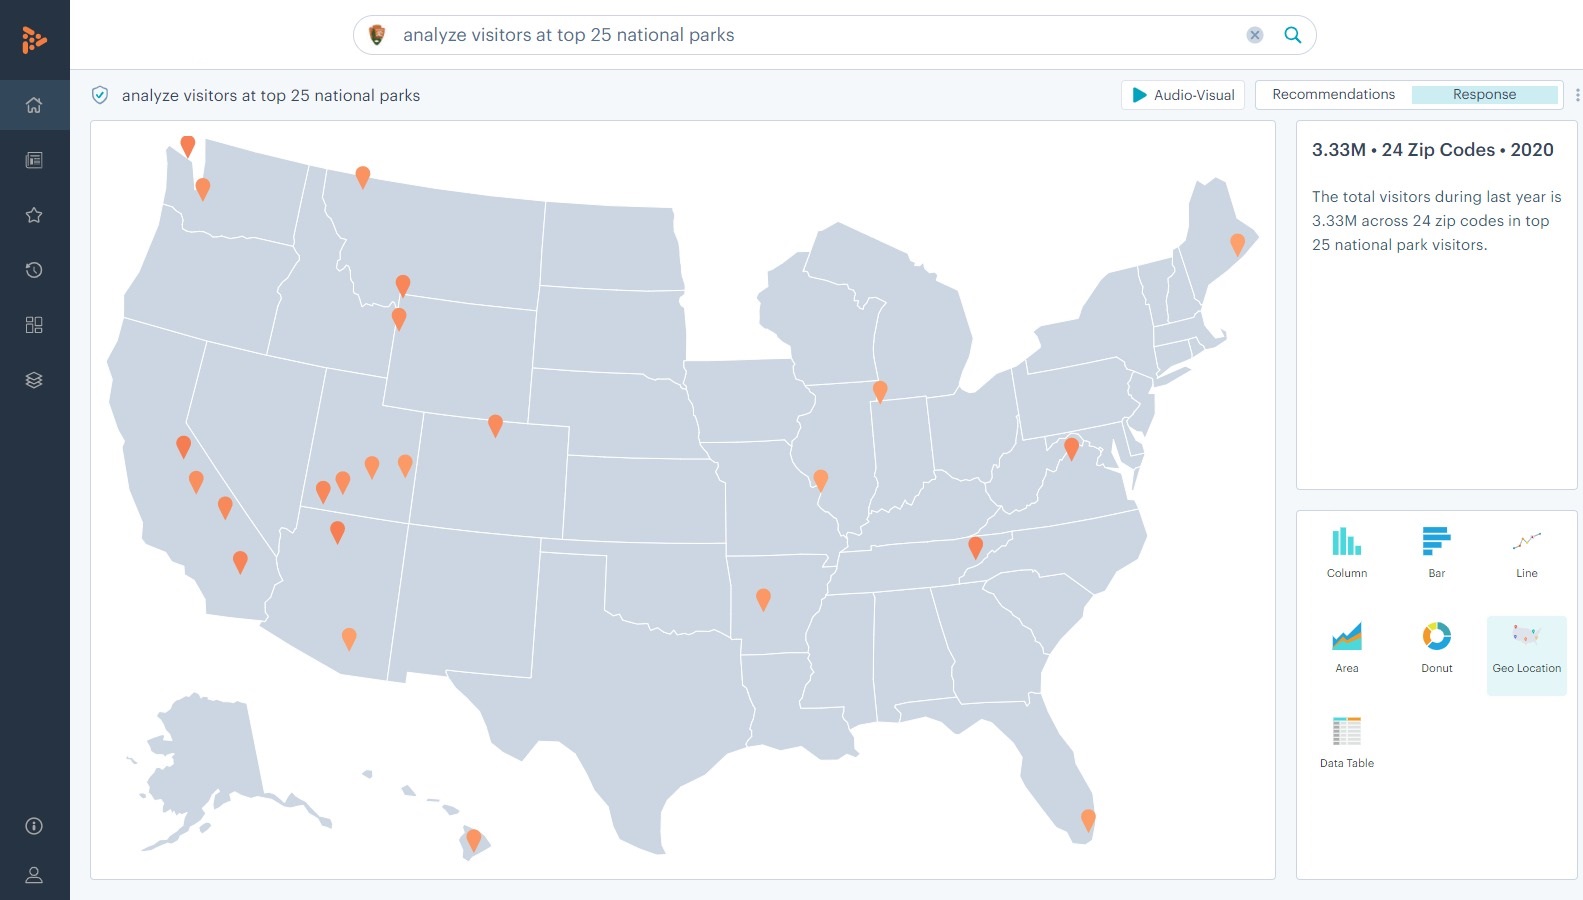
The depth of insights we got through this single question were astonishing: Though the number of national park visitors dropped by 56% in 2020, the number of backpackers actually doubled in Q4 2020 as compared to that in 2019.
MachEye went beyond the obvious to identify growth rate, seasonality, anomalies, and trends across different dimensions like region, national parks, visitor types, and time periods. To know what more insights MachEye found, read our blog on How Backpacking in National Parks Increased 200% due to COVID-19.
What are the critical capabilities of a search-driven analytics platform?
The following are 10 critical capabilities that organizations should look for in a search-driven analytics platform.
- Natural language search: Making users comfortable in conversing with enterprise data by using simple language is the most important capability of any search-driven analytics platform. With natural language search , users become self-reliant and can perform analytics better and faster.
- Search suggestions: When users don’t know what they are looking for or can’t think of where to start searching, search suggestions offer ready-made search queries and most searched terms to guide users in exploring their data.
- Contextual search: Same words can have different meanings and contexts. Questions like “sales in California” can be asked for both the state and the city of California. Having contextual search makes users aware of such possible choices and helps them choose their required context for search.
- Ambiguity corrections: The ability to identify ambiguity in users’ questions, interpret the expected intent, and provide the closest possible options helps in correcting and refining the questions to arrive at the correct answers.
- Query processing transparency: It is important that users understand how their questions are interpreted and processed to find answers. Sharing the query processing increases transparency, improves understanding, and builds trust of users in the analytics process.
- Advanced insights: With search-driven analytics, users can deep dive in their data easily to see advanced insights like anomalies, analogies, trends, and clusters emerge from data. These insights can help users go beyond answers to form a comprehensive understanding of the what, why and how of business events.
- Audio-visual stories: Interactive audio-visual stories and visualizations present insights in a more understandable and engaging way for users, just like YouTube videos they see for gaining information on various topics.
- Textual summaries: Interpreting a visualization becomes fast and easy with textual summaries. Users don’t have to spend time analyzing the charts. This also minimizes the chances of users missing out on important data points, since they are published upfront in textual summaries.
- Personalized insights: Learning from what users frequently search and taking into consideration their role and interests, search-driven analytics can offer personalized actionable insights to users. This way, users can focus better with insights that matter to them and their work.
- Dashboard and sharing: Users don’t work in isolation and need to frequently present and share insights with their teams. Search-driven analytics platforms that enable easy dashboard creation and sharing of insights drive collaboration, productivity, and unison within teams.
How data observability makes search-driven analytics platforms reliable?
The quality of the data significantly influences the quality of insights derived from it. If the base data is incorrect, no search technology, however advanced it may be, can help fetch accurate results. Incorrect insights can result in wrong decisions, wastage of efforts and resources, increased costs, and potential losses. So data observability becomes an essential must-have in any search-driven analytics platform.
Data observability offers clear visibility of data quality present in the data store. Data must be evaluated on different quality parameters such as completeness, consistency, integrity, interpretability, timeliness, and uniqueness. This thorough evaluation can help assess quality at granular levels, eliminate blind spots, and help gain complete control of data. By identifying issues early, users can fix them promptly and enrich data further to ensure reliable and trusted insights. Data observability also helps in improving efficiency and implementing good data governance across the organization.
How MachEye fits into your data stack?
MachEye transforms the data analytics paradigm by bringing the convenience of everyday internet search to enterprise data through its augmented analytics platform. With an intuitive search interface and intelligent search technology, MachEye empowers business users to perform their own analysis by simply asking questions in natural language. This transforms business users into analysts and helps them make data-driven decisions better and faster.
MachEye makes data consumable with its interactive audio-visual stories stories and actionable with its advanced insights and root cause analysis. It not only ensures data observability but also guides users to fix quality issues and enrich their data. Data is democratized, insights become actionable, and time-to-insights is reduced significantly with MachEye. This helps in increasing data literacy, improving data governance, and bringing operational efficiencies across the organization.